

Solver Marketplace
Explore based on functionality (reports, planning, and dashboard templates), or use the search function to filter by integration, industry, or to find a template that fits your specific needs. Save templates to your favorites list and use the "Share Favorites" link to share the list with others.
Icon Legend:
💲 Requires consulting hours to set up and configure
⭐ Save as a favorite and share with others
FUNCTIONALITY
- Reports
- Planning
- Dashboard
Data Source
Marketplace Data Source: Filter by Data Source to find assets specific to your system
Showcase Data Source: Filter by Data Source to find assets specific to your system
Industries
Marketplace Industries: Filter by Industries to find assets specific to your system
Showcase Industries: Filter by Industries to find assets specific to your system
industries
Marketplace Industries: Filter by your industry to find assets created for your specific needs
Showcase Industries: Filter by your industry to find assets created for your specific needs
445 - 450 of 868 Results
Favorite Page Results
Favorites


Reports
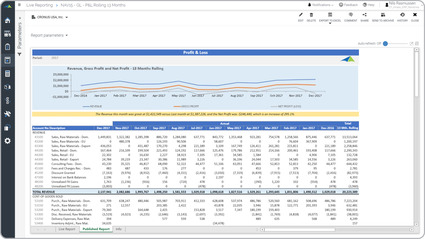
P&L – Rolling 13 Month Trend
Some of the key functionality visual trend report is that it is parameter driven and based on the period the user runs it for, it will dynamically display the past thirteen months across the columns.
$
Reports
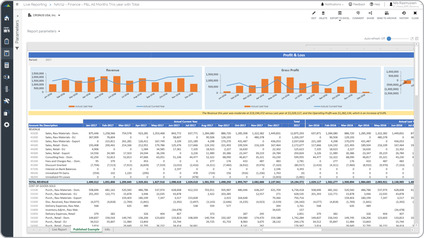
P&L – Trend Analysis vs Prior Year
Trended Profit & Loss (P&L) Some of the key functionality visual financial report is that it provides deep analysis with three different sections:. Automated narrative (yellow row in the example),.
$
Reports
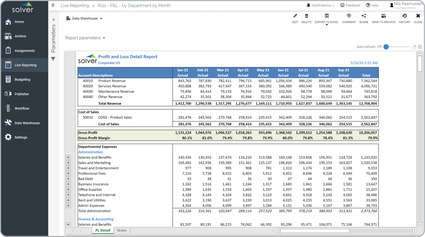
P&L – Trended with Accounts by Department
Key functionality report can dynamically display historical data for each month of the fiscal year up to the current period for which the user is running the report.
$
Reports
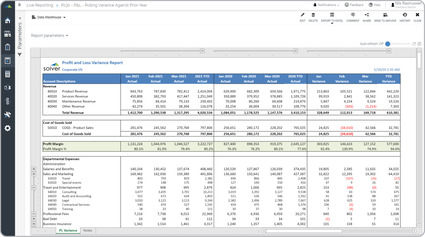
P&L – Trended, Current vs Last Year
Some functionality report will dynamically display all periods up to the current month for this year, as well as, for last year. It also provides year-over-year variances for each month.
$
Reports
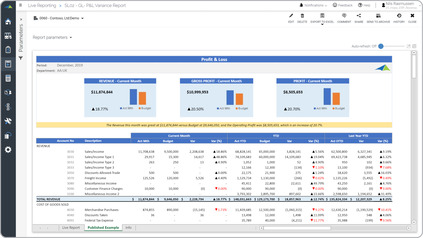
P&L – Variance Report
Profit & Loss (P&L) Some of the key functionality visual P&L report is that it is parameter driven and enhances analysis with its three different sections.
$
Reports
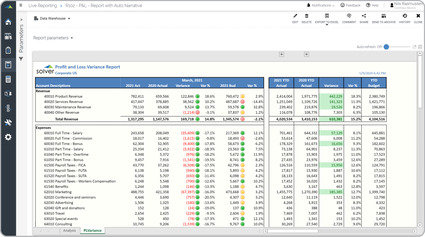
P&L – Variance vs Last Year and Budget
Key functionality automatically provides a presentation-quality layout with account-level detail and traffic lights that highlight important variances.
$