

Solver Marketplace
Explore based on functionality (reports, planning, and dashboard templates), or use the search function to filter by integration, industry, or to find a template that fits your specific needs. Save templates to your favorites list and use the "Share Favorites" link to share the list with others.
Icon Legend:
💲 Requires consulting hours to set up and configure
⭐ Save as a favorite and share with others
FUNCTIONALITY
- Reports
- Planning
- Dashboard
Data Source
Marketplace Data Source: Filter by Data Source to find assets specific to your system
Showcase Data Source: Filter by Data Source to find assets specific to your system
Industries
Marketplace Industries: Filter by Industries to find assets specific to your system
Showcase Industries: Filter by Industries to find assets specific to your system
industries
Marketplace Industries: Filter by your industry to find assets created for your specific needs
Showcase Industries: Filter by your industry to find assets created for your specific needs
457 - 462 of 868 Results
Favorite Page Results
Favorites


Reports
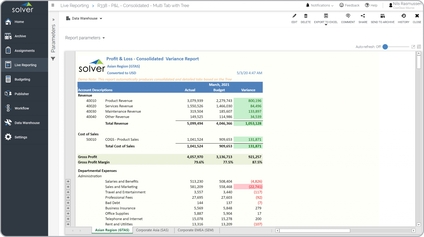
P&L Consolidated Monthly Variance Report
It automatically produces a multi-tab output based on a consolidation tree selected at run time.
$
Reports
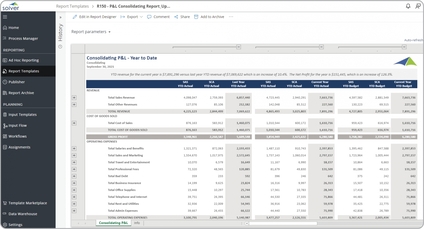
P&L Consolidating Report - Displays Companies
Presents a consolidating P&L with individual company columns alongside consolidated totals. Enables side-by-side entity profitability comparison.
$
Reports
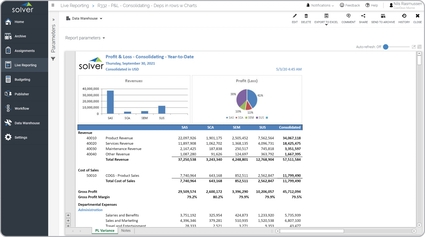
P&L Consolidating YTD Report
Key functionality report will display year-to-date (YTD) data for subsidiaries across the columns with a consolidated total. The report can be produced in any currency and the charts on the top provide managers with easy comparative analysis.
$
Reports
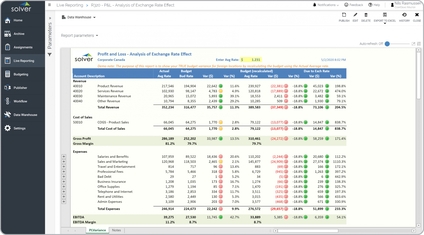
P&L Currency Analysis
A key functionality financial report automatically re-calculates the Budget to use the same rate as the Actual data. Managers can directly compare the regular budget variance (at the budget rate) with the recalculated budget (at the actual rate).
$
Planning
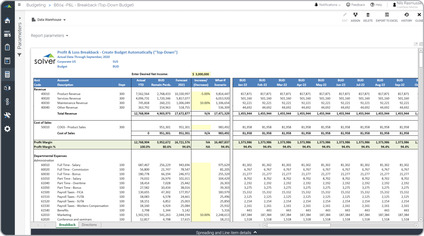
P&L driver-based budget
Top-down Profit & Loss (P&L) budget models are considered what-if, break-back or modeling (depending on who you ask) templates and are used by budget managers and analysts to quickly create budget or forecasts scenarios.
$
Reports
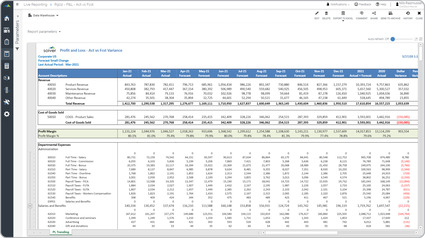
P&L Estimate
Profit & Loss Forecasts are considered one of the most popular type of planning models and are used by CFOs and planning managers to help plan any activity that will be driven by revenues, expenses and profitability.
$