

Solver Marketplace
Explore based on functionality (reports, planning, and dashboard templates), or use the search function to filter by integration, industry, or to find a template that fits your specific needs. Save templates to your favorites list and use the "Share Favorites" link to share the list with others.
Icon Legend:
💲 Requires consulting hours to set up and configure
⭐ Save as a favorite and share with others
FUNCTIONALITY
- Reports
- Planning
- Dashboard
Data Source
Marketplace Data Source: Filter by Data Source to find assets specific to your system
Showcase Data Source: Filter by Data Source to find assets specific to your system
Industries
Marketplace Industries: Filter by Industries to find assets specific to your system
Showcase Industries: Filter by Industries to find assets specific to your system
industries
Marketplace Industries: Filter by your industry to find assets created for your specific needs
Showcase Industries: Filter by your industry to find assets created for your specific needs
439 - 444 of 868 Results
Favorite Page Results
Favorites


Reports
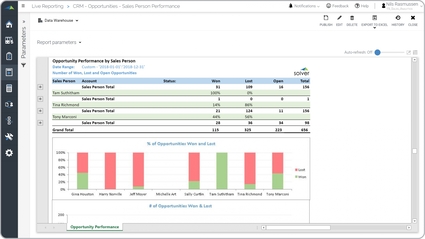
Opportunity Win Loss Analysis
It pulls data from the company's CRM system and uses advanced filters and groupings to provide an easy to read sales performance report. Each sales person is listed in the rows with a grand total at the bottom.
$
Reports
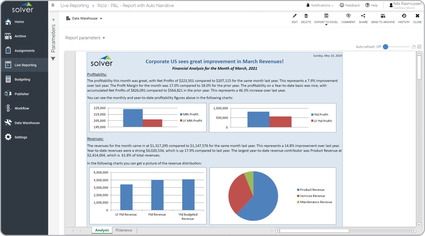
P&L – Auto Narrated
Narrative Financial Reports are considered easy-to-read financial summaries and are often used by Financial Analysts and CFOs to provide end users with a very easy-to-read, newspaper-like cover page for their Profit & Loss and other number-intense reports.
$
Reports
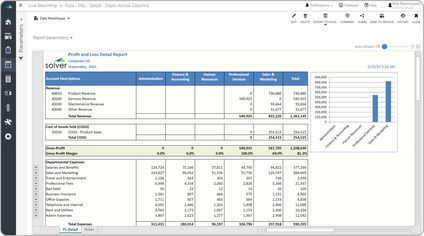
P&L – Departments in Columns
A Profit & Loss Report with Department Comparisons is a financial statement that provides a side-by-side view of different departments within an organization.
$
Reports
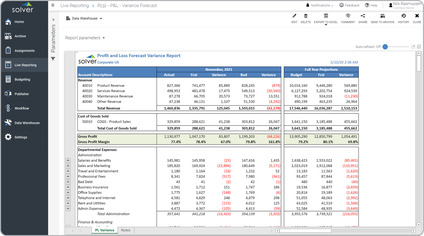
P&L – Estimate vs Budget
It provides actual to budget and forecast comparisons for the current period. It also shows the full year budget versus the revised forecast. Rows are grouped by department and can be expanded to view the individual accounts.
$
Reports
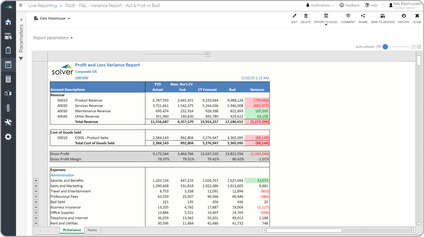
P&L – Estimate with Act and Forecast
Key functionality automatically calculates the year-end estimate based on actual figures year-to-date plus the forecast for the remainder of the year.
$
Reports
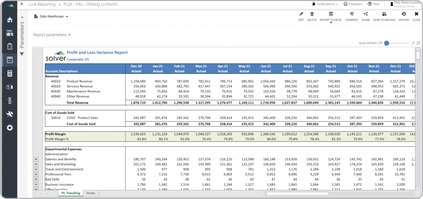
P&L – Rolling 13 Month
Key functionality report automatically displays the full profit & loss for the current month as well as the prior 12 months. This feature is driven by the period parameter the user enters to run the report.
$