

Solver Marketplace
Explore based on functionality (reports, planning, and dashboard templates), or use the search function to filter by integration, industry, or to find a template that fits your specific needs. Save templates to your favorites list and use the "Share Favorites" link to share the list with others.
Icon Legend:
💲 Requires consulting hours to set up and configure
⭐ Save as a favorite and share with others
FUNCTIONALITY
- Reports
- Planning
- Dashboard
Data Source
Marketplace Data Source: Filter by Data Source to find assets specific to your system
Showcase Data Source: Filter by Data Source to find assets specific to your system
Industries
Marketplace Industries: Filter by Industries to find assets specific to your system
Showcase Industries: Filter by Industries to find assets specific to your system
industries
Marketplace Industries: Filter by your industry to find assets created for your specific needs
Showcase Industries: Filter by your industry to find assets created for your specific needs
451 - 456 of 868 Results
Favorite Page Results
Favorites


Reports
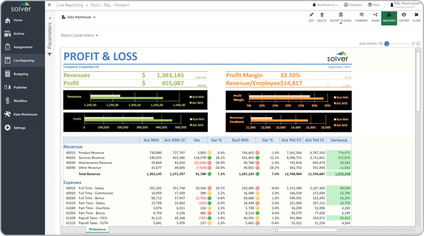
P&L – Variance, Modern Design
Modern Profit & Loss Reports with KPIs are considered a new trend in user-friendly reports and are often used by executives and financial managers to analyze profitability, revenues and expenses.
$
Planning
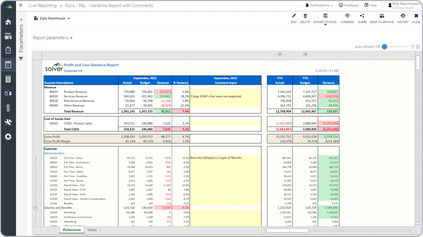
P&L – With Comment Column
Profit & Loss reports with comment sections are considered interactive financial statements and are often used by finance teams to enter comments that explain financial figures.
$
Reports
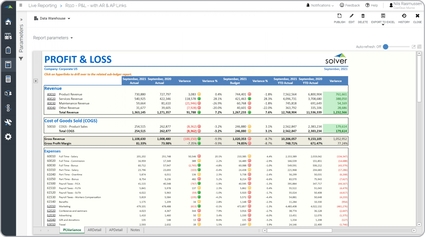
P&L – With links to AR & AP Reports
Financial statements with links to sub-ledger reports are considered self-service analysis reports and are often used by managers and accountants to provide users with easy answers to their questions.
$
Reports
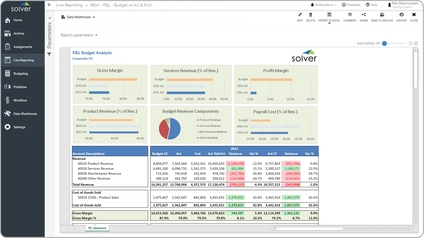
P&L Budget Report
A key functionality management report will compare the budget to actual year-to-date numbers plus forecast for the rest of the year. It also shows variances between the budget and last year's actual results.
$
Reports
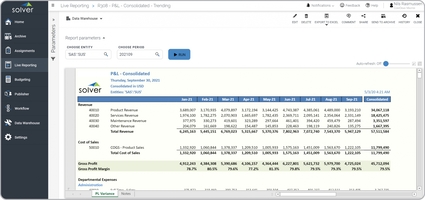
P&L Consolidated Trending
A key functionality report can present financials for both consolidated and for individual subsidiaries. The periods in the columns are dynamically rolled out to the current month. It is also typical to group the expenses by department.
$
Reports
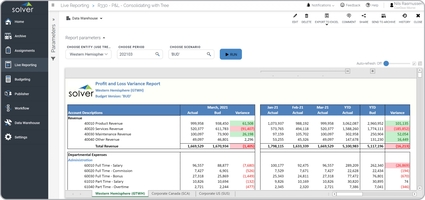
P&L Consolidated Variance Report
A key functionality automatically produces a multi-tab output based on a consolidation tree selected at run time. The top entity displays on the first tab, while divisions and their subsidiaries show on the following tabs.
$