

Solver Marketplace
Explore based on functionality (reports, planning, and dashboard templates), or use the search function to filter by integration, industry, or to find a template that fits your specific needs. Save templates to your favorites list and use the "Share Favorites" link to share the list with others.
Icon Legend:
💲 Requires consulting hours to set up and configure
⭐ Save as a favorite and share with others
FUNCTIONALITY
- Reports
- Planning
- Dashboard
Data Source
Marketplace Data Source: Filter by Data Source to find assets specific to your system
Showcase Data Source: Filter by Data Source to find assets specific to your system
Industries
Marketplace Industries: Filter by Industries to find assets specific to your system
Showcase Industries: Filter by Industries to find assets specific to your system
industries
Marketplace Industries: Filter by your industry to find assets created for your specific needs
Showcase Industries: Filter by your industry to find assets created for your specific needs
433 - 438 of 868 Results
Favorite Page Results
Favorites


Reports
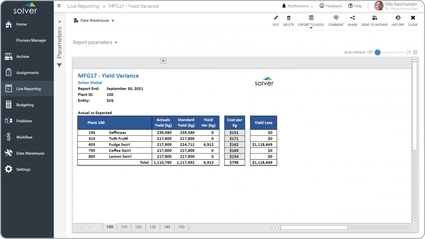
Mfg – Yield Variance
It is parameter driven so the user can run it for any period and any number of plants. One report per plant is automatically generated and displayed in the tabs at the bottom.
$
Reports
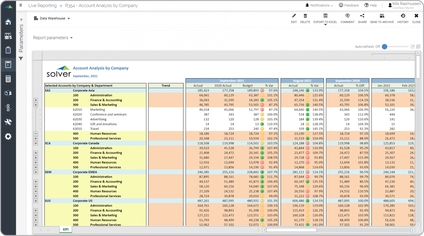
Multi-company Account Analysis
Some of the key functionality lets the user select which accounts to display. The report displays the chosen accounts by department and company with easily expandable rows.
$
Reports
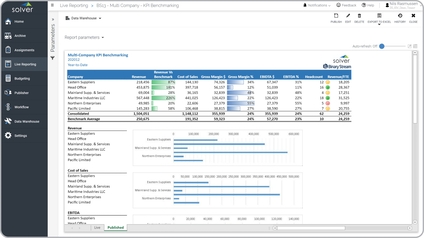
Multi-company KPI Benchmarking
Compares KPIs across multiple entities or business units in a single view. Enables CFOs and boards to benchmark performance, identify outliers, and drive organizational alignment.
$
Planning
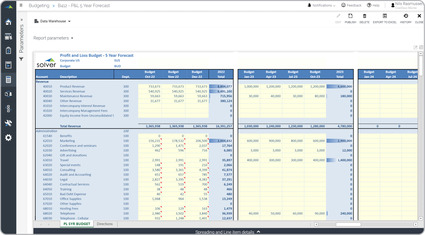
Multi-Year Forecast
A Multi-Year Forecast Input Template is a strategic planning tool used by executives and budget managers to gain a long-term perspective on an organization's financial outlook.
$
Reports
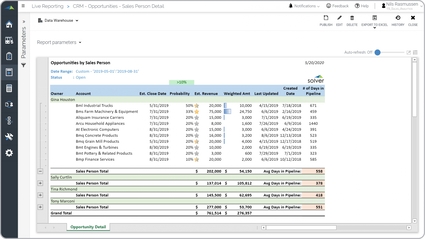
Opportunities by Sales Person
It pulls data from the company's CRM system and organizes it with easy to read KPIs. The filters in the report shows Open opportunities for a given date range and based on more than e.g. 10% probability.
$
Reports
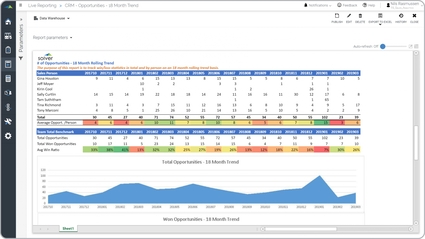
Opportunity Count Trend
They are often used by sales managers to review how the company in total and each sales person are doing in terms of volume of opportunities received and how many of these they turn into won deals.
$