

Solver Marketplace
Explore based on functionality (reports, planning, and dashboard templates), or use the search function to filter by integration, industry, or to find a template that fits your specific needs. Save templates to your favorites list and use the "Share Favorites" link to share the list with others.
Icon Legend:
💲 Requires consulting hours to set up and configure
⭐ Save as a favorite and share with others
FUNCTIONALITY
- Reports
- Planning
- Dashboard
Data Source
Marketplace Data Source: Filter by Data Source to find assets specific to your system
Showcase Data Source: Filter by Data Source to find assets specific to your system
Industries
Marketplace Industries: Filter by Industries to find assets specific to your system
Showcase Industries: Filter by Industries to find assets specific to your system
industries
Marketplace Industries: Filter by your industry to find assets created for your specific needs
Showcase Industries: Filter by your industry to find assets created for your specific needs
469 - 474 of 868 Results
Favorite Page Results
Favorites


Planning
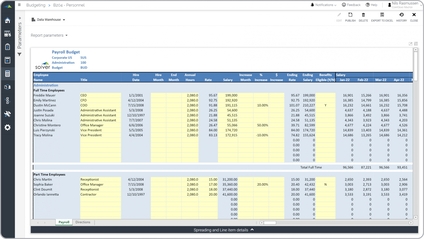
Payroll Budget
Some key functionality template allows the user to quickly generate departmental employee budgets by entering or adjusting annual salaries for salaried staff, and hours or rates for hourly employees.
$
Planning
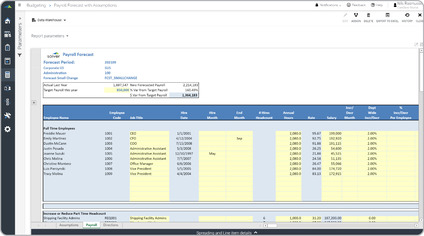
Payroll Forecast
A key functionality template allows the user to quickly enter the total target payroll expense and break it down to each position. Next, adjustments can be done at the indvidual/position level.
$
Reports
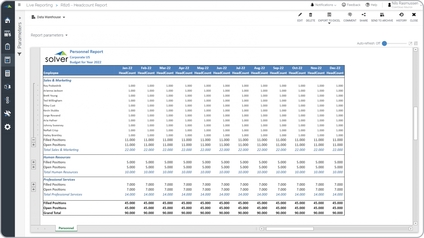
Personnel Budget Report
A key functionality personnel budget report provides integration with the payroll budget to automatically derive monthly headcount per department. Rows can be expanded to see each employee by department.
$
Planning
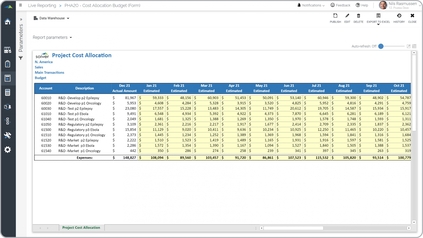
Pharma – Drug Project Cost Forecast
Some of the main functionality and budget model is that it shows the actual figures from the prior period and provides input (yellow cells in the image below) for the common year.
$
Reports
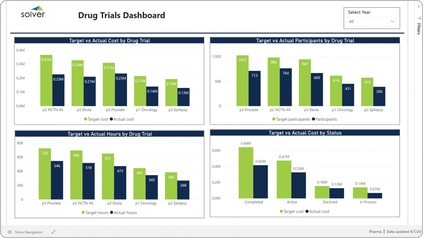
Pharma – Drug Trials Dashboard
Some of the main functionality graphical report is that it offers comparative analysis for four different metrics, including:. Target versus actual cost by drug trial,. Target versus actual hours by drug trial,.
$
Dashboard
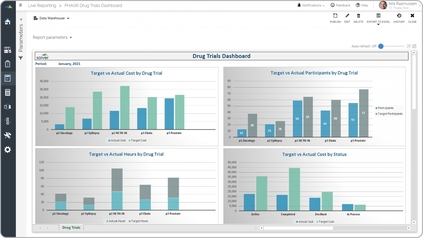
Pharma – Drug Trials Power BI Dashboard
It enables interactive analysis from four different perspectives, including:. Target versus actual cost per drug trial,. Target versus actual participants by drug trial,.
$