

Solver Marketplace
Explore based on functionality (reports, planning, and dashboard templates), or use the search function to filter by integration, industry, or to find a template that fits your specific needs. Save templates to your favorites list and use the "Share Favorites" link to share the list with others.
Icon Legend:
💲 Requires consulting hours to set up and configure
⭐ Save as a favorite and share with others
FUNCTIONALITY
- Reports
- Planning
- Dashboard
Data Source
Marketplace Data Source: Filter by Data Source to find assets specific to your system
Showcase Data Source: Filter by Data Source to find assets specific to your system
Industries
Marketplace Industries: Filter by Industries to find assets specific to your system
Showcase Industries: Filter by Industries to find assets specific to your system
industries
Marketplace Industries: Filter by your industry to find assets created for your specific needs
Showcase Industries: Filter by your industry to find assets created for your specific needs
397 - 402 of 868 Results
Favorite Page Results
Favorites


Dashboard
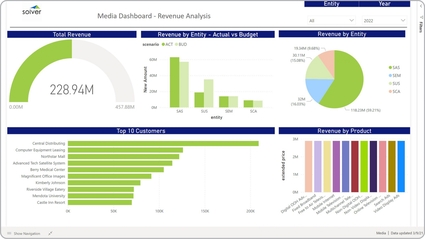
Media – Revenue Analysis
It enables analysis across five different perspectives, including:. Actual and budgeted revenue by business unit,. Revenue contribution (%) by division,.
$
Reports
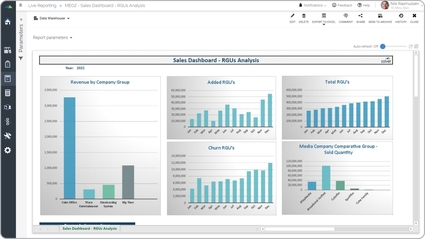
Media – RGU Sales Analysis
Revenue Generating Unit (RGU) Some of the main functionality KPI report is that it provides analysis of RGU metrics from five different perspectives:. Revenue comparison by media company (subsidiary),. Monthly trend in Added RGUs,.
$
Reports
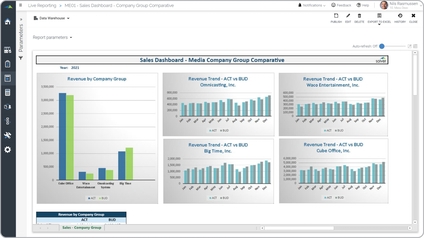
Media – Sales Dashboard
It provides sales comparisons from two different perspectives:. Actual and budget benchmark across the company's subsidiaries,. Revenue trend for each subsidiary with actual and budget comparison.
$
Planning
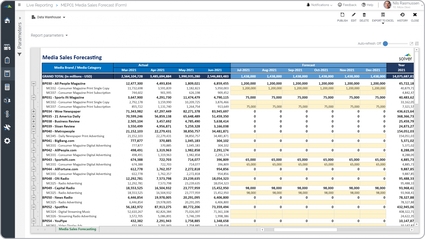
Media – Sales Forecasting
Some of the main functionality input template is that it automatically displays the actual data for the historical months and opens the remainder periods of the year for input.
$
Reports
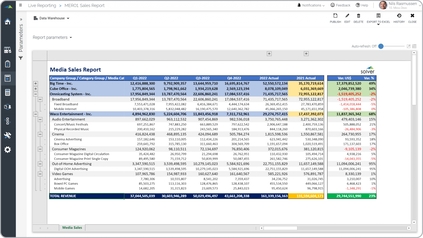
Media – Sales Report
It shows sales by category, category group and company for any chosen period.
$
Reports
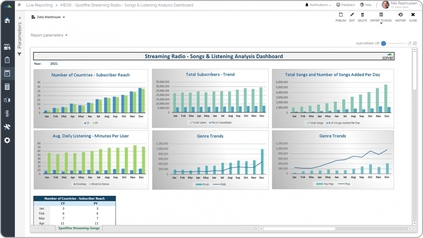
Media – Songs and Listening Analysis
It provides monthly trend analysis from six different perspectives:. Current year (CY) and prior year (PY) by number of countries reached,.
$