

Solver Marketplace
Explore based on functionality (reports, planning, and dashboard templates), or use the search function to filter by integration, industry, or to find a template that fits your specific needs. Save templates to your favorites list and use the "Share Favorites" link to share the list with others.
Icon Legend:
💲 Requires consulting hours to set up and configure
⭐ Save as a favorite and share with others
FUNCTIONALITY
- Reports
- Planning
- Dashboard
Data Source
Marketplace Data Source: Filter by Data Source to find assets specific to your system
Showcase Data Source: Filter by Data Source to find assets specific to your system
Industries
Marketplace Industries: Filter by Industries to find assets specific to your system
Showcase Industries: Filter by Industries to find assets specific to your system
industries
Marketplace Industries: Filter by your industry to find assets created for your specific needs
Showcase Industries: Filter by your industry to find assets created for your specific needs
385 - 390 of 868 Results
Favorite Page Results
Favorites


Reports
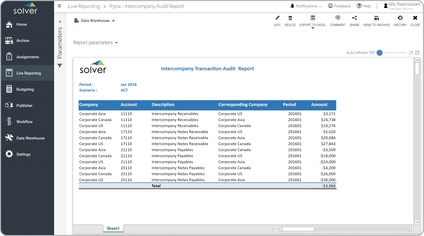
Intercompany Audit Report
One key functionality report will find internal transactions that have taken place between subsidiaries during the month. This includes sales, purchases, payables and receivables. The report also displays both the due-to and due-from parties in a transaction.
$
Planning
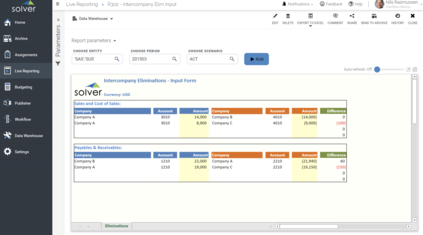
Intercompany Elimination Input
Structured input form for entering intercompany elimination entries directly in Solver during financial consolidation. Reduces manual work and ensures audit-ready intercompany reconciliation.
$
Planning
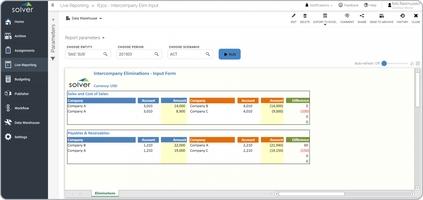
Intercompany Elimination Input Form
Extended input form for managing intercompany eliminations across multiple entities during consolidation. Supports complex multi-entity structures with detailed elimination tracking.
$
Reports
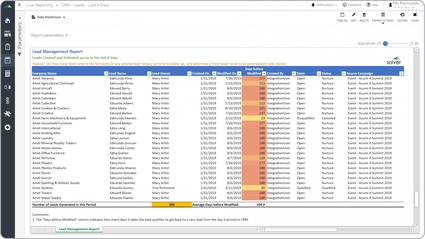
Lead Follow-up Tracking Report
It brings in data from the company's CRM system and provides transactional detail as well as summary KPIs. The report can be produced for any given date range such as the current week or month or year-to-date.
$
Reports
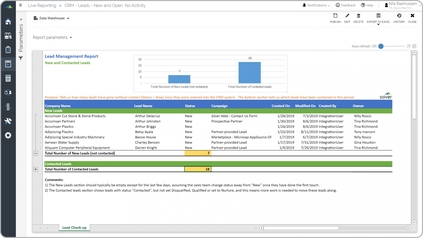
Lead Management Report
It gives managers a quick picture of lead KPIs. The rows has two main sections: The top one lists New Leads with a total and the bottom one lists Contacted Leads with a total.
$
Dashboard
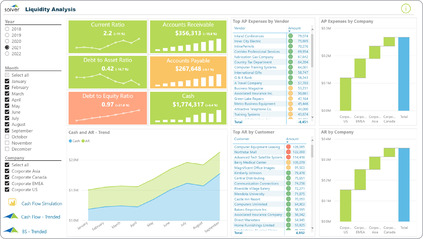
Liquidity Analysis
It shows trends in important metrics such as current ratio, debt-to-asset ratio, debt-to-equity ratio, receivables, payables and cash. It also displays rankings of top payables by vendor and top receivables by customer.
$