

Solver Marketplace
Explore based on functionality (reports, planning, and dashboard templates), or use the search function to filter by integration, industry, or to find a template that fits your specific needs. Save templates to your favorites list and use the "Share Favorites" link to share the list with others.
Icon Legend:
💲 Requires consulting hours to set up and configure
⭐ Save as a favorite and share with others
FUNCTIONALITY
- Reports
- Planning
- Dashboard
Data Source
Marketplace Data Source: Filter by Data Source to find assets specific to your system
Showcase Data Source: Filter by Data Source to find assets specific to your system
Industries
Marketplace Industries: Filter by Industries to find assets specific to your system
Showcase Industries: Filter by Industries to find assets specific to your system
industries
Marketplace Industries: Filter by your industry to find assets created for your specific needs
Showcase Industries: Filter by your industry to find assets created for your specific needs
403 - 408 of 868 Results
Favorite Page Results
Favorites
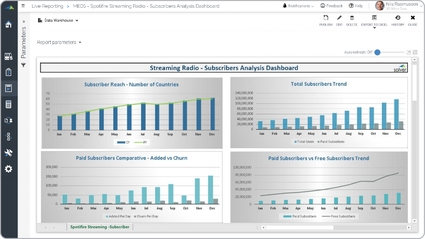


Reports
Media – Streaming Radio Analysis
It shows monthly trends for six different KPIs, including:. Current year (CY) and prior year (PY) subscriber reach by number of countries,.
$
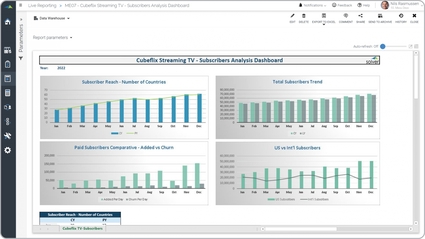
Reports
Media – Streaming TV Analysis
It provides monthly trend analysis from four different perspectives:. Current year (CY) and prior year (PY) subscribers by number of countries reached,. Paid subscribers added versus churned,.
$
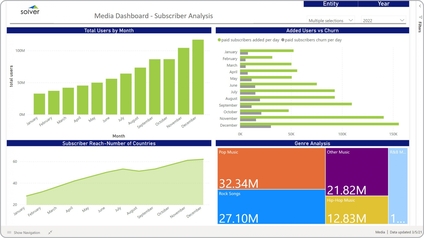
Dashboard
Media – Subscriber Analysis
It provides analysis of user KPIs from four different perspectives, including:. Monthly trend in total number of users,. Number of added users and churn per day,.
$
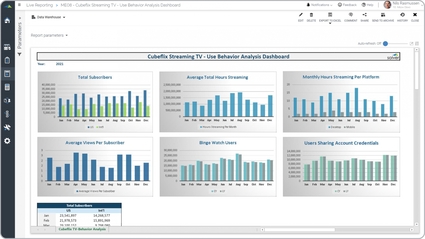
Reports
Media – Use Behavior Analysis
Analyzes audience or subscriber usage behavior patterns across content types, platforms, and time periods. Helps media finance and product teams understand consumption trends and optimize content monetization.
$
Dashboard
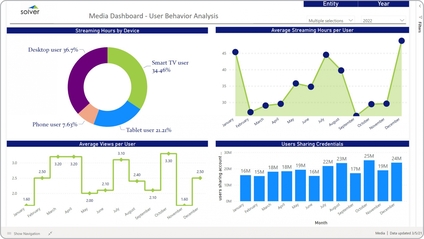
Media – User Behavior Analysis
It enables graphical analysis of user behavior from four different perspectives, including:.
$
Dashboard
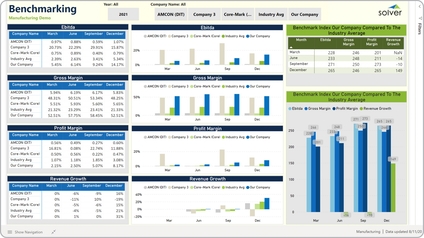
Mfg – Benchmarking
It enables the user to select which companies (including the industry average) and year to use in the analysis, and then it will provide graphical comparison.
$