

Solver Marketplace
Explore based on functionality (reports, planning, and dashboard templates), or use the search function to filter by integration, industry, or to find a template that fits your specific needs. Save templates to your favorites list and use the "Share Favorites" link to share the list with others.
Icon Legend:
💲 Requires consulting hours to set up and configure
⭐ Save as a favorite and share with others
FUNCTIONALITY
- Reports
- Planning
- Dashboard
Data Source
Marketplace Data Source: Filter by Data Source to find assets specific to your system
Showcase Data Source: Filter by Data Source to find assets specific to your system
Industries
Marketplace Industries: Filter by Industries to find assets specific to your system
Showcase Industries: Filter by Industries to find assets specific to your system
industries
Marketplace Industries: Filter by your industry to find assets created for your specific needs
Showcase Industries: Filter by your industry to find assets created for your specific needs
409 - 414 of 868 Results
Favorite Page Results
Favorites


Dashboard
Reports
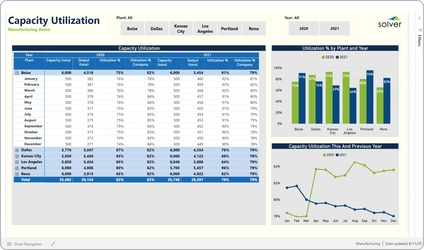
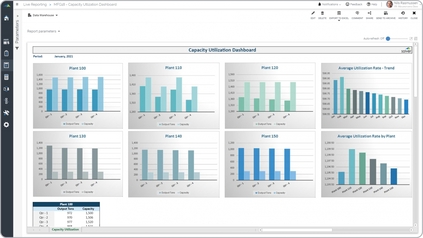
Mfg – Capacity Utilization by Plant
Utilization analysis dashboards with comparative analysis are considered benchmarking tools and are often used by plant and operations managers to track utilization by facility and to easily see exceptions.
$
Planning
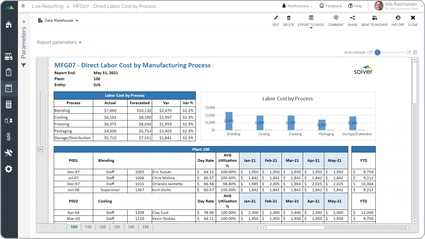
Mfg – Direct Labor Cost by Process
It shows day rates and average utilization per team member. Figures are shown both for each month as well as year-to-date. On the top of the report, actual is compared to forecast at the plant level.
$
Reports
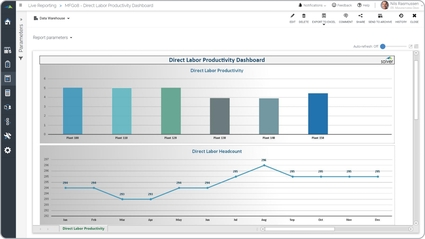
Mfg – Direct Labor Productivity
It can be executed for any month and will dynamically display periods and plants across the two charts.
$
Reports
Mfg – Direct Labor Turnover Analysis
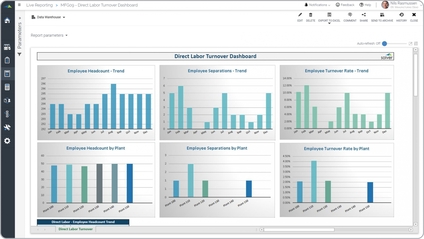
It provides graphical workforce analysis of monthly trends as well as KPI benchmarking across plants. The three charts on the top shows.
$
Reports
Mfg – Equipment Maintenance Report
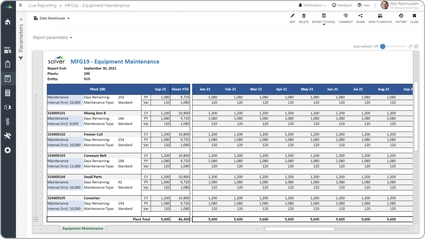
It lists months across the columns and equipment down the rows.
$