

Solver Marketplace
Explore based on functionality (reports, planning, and dashboard templates), or use the search function to filter by integration, industry, or to find a template that fits your specific needs. Save templates to your favorites list and use the "Share Favorites" link to share the list with others.
Icon Legend:
💲 Requires consulting hours to set up and configure
⭐ Save as a favorite and share with others
FUNCTIONALITY
- Reports
- Planning
- Dashboard
Data Source
Marketplace Data Source: Filter by Data Source to find assets specific to your system
Showcase Data Source: Filter by Data Source to find assets specific to your system
Industries
Marketplace Industries: Filter by Industries to find assets specific to your system
Showcase Industries: Filter by Industries to find assets specific to your system
industries
Marketplace Industries: Filter by your industry to find assets created for your specific needs
Showcase Industries: Filter by your industry to find assets created for your specific needs
157 - 162 of 873 Results
Favorite Page Results
Favorites


Reports
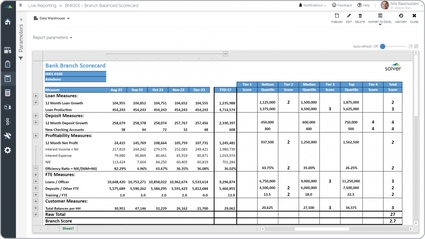
Bank – Branch Scorecard
Some of the main functionality strategic report is that it presents a total score per bank branch based on a series of strategic KPIs. These include: Loan measures, Deposit measures, Profitability measures, FTE measures, and Customer measures.
$
Reports
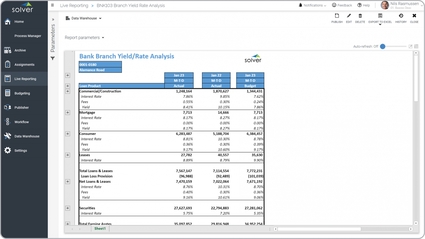
Bank – Branch Yield Rate Analysis
It is parameter-driven by branch and period and it compares current month metrics with prior year and budget.
$
Reports
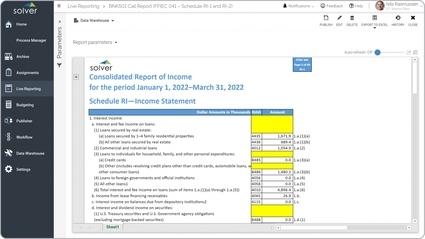
Bank – Call Report Example
The Consolidated Statement of Income is considered a Call Report and is used by accountants and compliance managers to submit quarterly data as per Office of the Comptroller of the Currency (OCC) requirements.
$
Reports
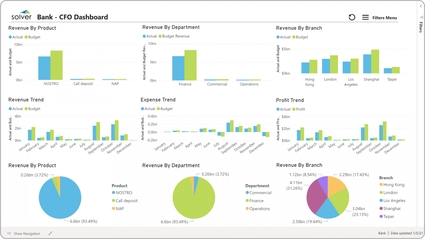
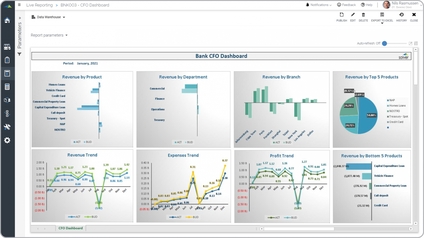
Bank – CFO Dashboard
It provides graphical analysis of eight different metrics, including:. Actual versus budgeted revenues by product,. Monthly revenue trend,.
$
Dashboard
Bank – CFO Power BI Dashboard
It provides financial analysis from nine different perspectives:. Actual and budget revenue by product,. Monthly actual and budget revenue trend,.
$
Reports
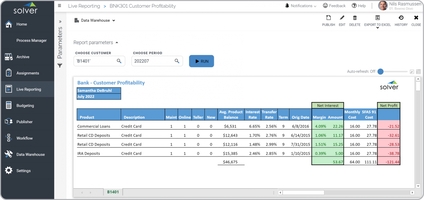
Bank – Customer Profitability
It enables the user to select the customer and the period to see the profitability by product and in total.
$