

Solver Marketplace
Explore based on functionality (reports, planning, and dashboard templates), or use the search function to filter by integration, industry, or to find a template that fits your specific needs. Save templates to your favorites list and use the "Share Favorites" link to share the list with others.
Icon Legend:
💲 Requires consulting hours to set up and configure
⭐ Save as a favorite and share with others
FUNCTIONALITY
- Reports
- Planning
- Dashboard
Data Source
Marketplace Data Source: Filter by Data Source to find assets specific to your system
Showcase Data Source: Filter by Data Source to find assets specific to your system
Industries
Marketplace Industries: Filter by Industries to find assets specific to your system
Showcase Industries: Filter by Industries to find assets specific to your system
industries
Marketplace Industries: Filter by your industry to find assets created for your specific needs
Showcase Industries: Filter by your industry to find assets created for your specific needs
163 - 168 of 873 Results
Favorite Page Results
Favorites


Reports
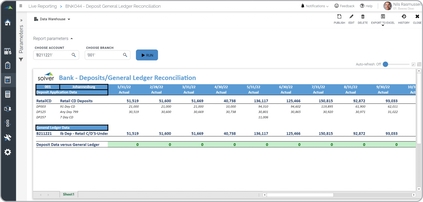
Bank – Deposits/General Ledger Reconciliation
It for any given GL account chosen by the user will list and match with the related deposit transactions.
$
Reports
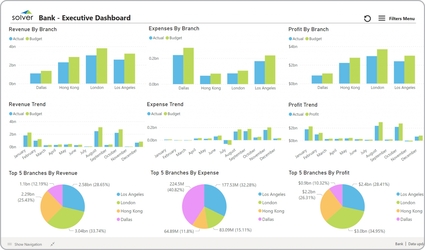
Bank – Executive Dashboard
Executive Dashboards are considered interactive decision-making tools and are used by senior leaders to monitor trends and benchmark financial KPIs across bank branches.
$
Dashboard
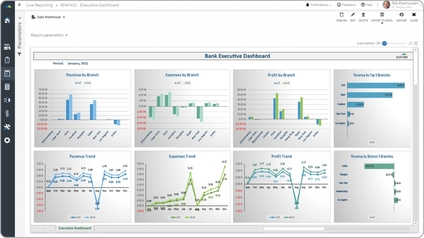
Bank – Executive Power BI Dashboard
Provides bank executives with a Power BI view of key financial KPIs including NIM, loan-to-deposit ratio, efficiency ratio, and asset quality in a single interactive interface.
$
Reports
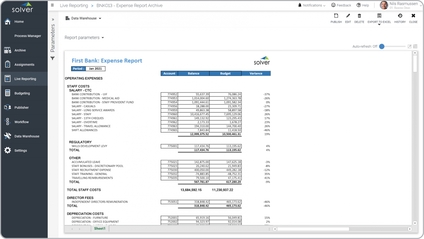
Bank – Expense Report
It dynamically expands expense accounts down the rows and summarize them to sub-totals and a grand total. The three columns show.
$
Reports
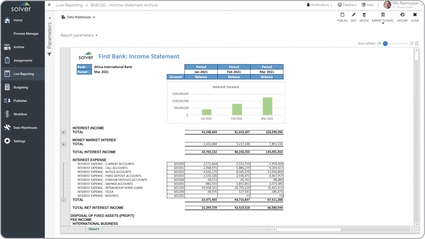
Bank – Income Statement – Monthly Trend
It dynamically expands months across the columns based on the period you run the report for. The rows in the reports are collapsed to provide an easily readable summary.
$
Reports
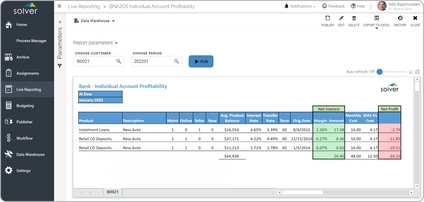
Bank – Individual Account Profitability
It enables the user to select the customer account and the period to see the profitability by product and in total.
$