

Solver Marketplace
Icon Legend:
💲 Requires consulting hours to set up and configure
⭐ Save as a favorite and share with others
- Reports
- Planning
- Dashboard
Marketplace Data Source: Filter by Data Source to find assets specific to your system
Showcase Data Source: Filter by Data Source to find assets specific to your system
Marketplace Industries: Filter by Industries to find assets specific to your system
Showcase Industries: Filter by Industries to find assets specific to your system
Marketplace Industries: Filter by your industry to find assets created for your specific needs
Showcase Industries: Filter by your industry to find assets created for your specific needs
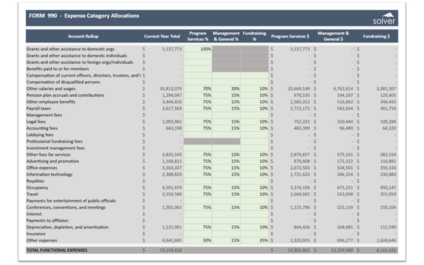


Nonprofit Essentials - Form 990 Expense Allocation
The Form 990 Expense Allocation in Solver is a pre-built xFP&A planning template for the nonprofit industry. Designed for nonprofit organizations, it lets finance teams set the functional allocation percentages that split each Form 990 expense line between Program Services, Management and General, and Fundraising. The template applies those percentages to current-year totals and shows the resulting dollar amounts.
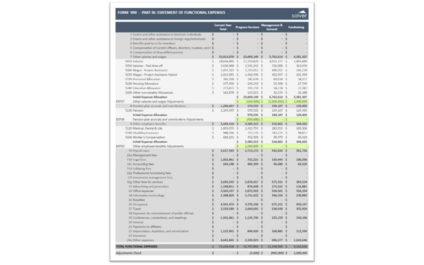
Nonprofit Essentials - Form 990
The Form 990 in Solver is a pre-built xFP&A planning template for the nonprofit industry. Designed for nonprofit organizations, it assembles Form 990 content in a multi-tab workbook covering the header, compensation, revenue, expenses, and balance sheet parts. The Part IX Statement of Functional Expenses presents each expense line by Program Services, Management and General, and Fundraising.
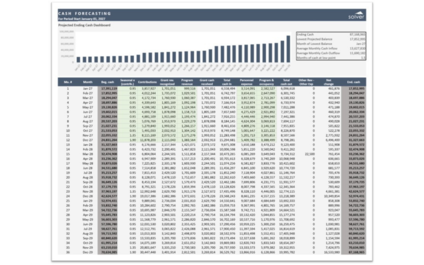
Nonprofit Essentials - Cash Flow Forecast
The Cash Flow Forecast in Solver is a pre-built xFP&A planning template for the nonprofit industry. Designed for nonprofit organizations, it projects cash month by month over a 36-month horizon. A Projected Ending Cash dashboard charts the balance over time and summarizes key measures such as ending cash, the lowest projected balance, the month it occurs, average monthly inflows and outflows, and months of cash at the low point.