

Solver Marketplace
Explore based on functionality (reports, planning, and dashboard templates), or use the search function to filter by integration, industry, or to find a template that fits your specific needs. Save templates to your favorites list and use the "Share Favorites" link to share the list with others.
Icon Legend:
💲 Requires consulting hours to set up and configure
⭐ Save as a favorite and share with others
FUNCTIONALITY
- Reports
- Planning
- Dashboard
Data Source
Marketplace Data Source: Filter by Data Source to find assets specific to your system
Showcase Data Source: Filter by Data Source to find assets specific to your system
Industries
Marketplace Industries: Filter by Industries to find assets specific to your system
Showcase Industries: Filter by Industries to find assets specific to your system
industries
Marketplace Industries: Filter by your industry to find assets created for your specific needs
Showcase Industries: Filter by your industry to find assets created for your specific needs
145 - 150 of 873 Results
Favorite Page Results
Favorites


Reports
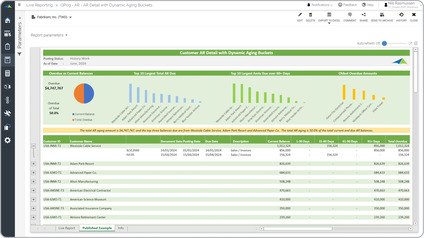
AR Report with Dynamic Aging
Accounts Receivable (AR) It dynamically calculates and displays outstanding amounts by querying transactions within date ranges like 0-30 days, 31-60 days and so on.
$
Reports
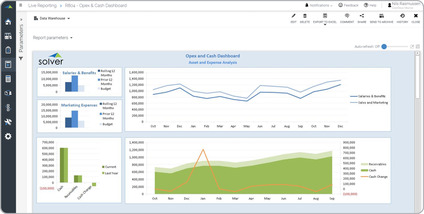
Asset and Expense Trend Analysis
A key functionality report will dynamically display the past 15 months of salaries, sales & marketing expenses, cash and receivables. It also shows the month-over-month change in cash. The charts makes it easy to follow the trends.
$
Reports
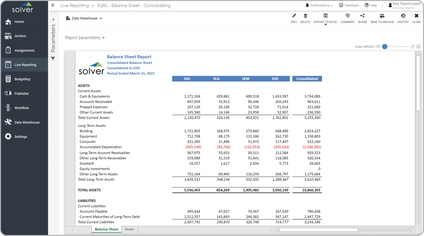
Balance Sheet – Consolidating
Consolidating Balance Sheet Reports are considered month-end consolidation tools and are used by CFOs and Group Controllers to compare and consolidate subsidiary balance sheets.
$
Reports
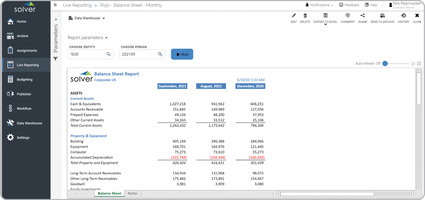
Balance Sheet – Monthly
Some functionality report is parameter driven and will populate the data and headers in three columns.
$
Reports
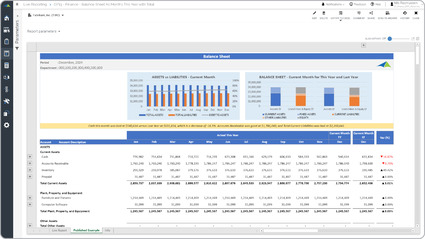
Balance Sheet – Trended
It dynamically displays each month up the the current period this year as well as the same months for the prior year.
$
Reports
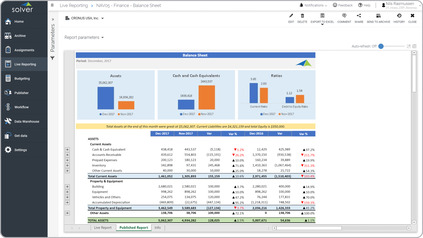
Balance Sheet – Variance Report
It enhances analysis by providing a three section report:. Charts for Assets, Cash and Ratios,. Automated narrative,.
$