

Purpose of Executive Financial Dashboards Banks use Executive Financial Dashboards to give their leaders an easy way to monitor top level financial KPIs and to do comparisons across their business units. When used as part of good business practices in Executive and Financial Planning & Analysis (FP&A) departments, a company can improve its strategies and resulting financial results, and it can reduce the chances that senior leaders have to delay decision-processes due to lack of clear, real time metrics.
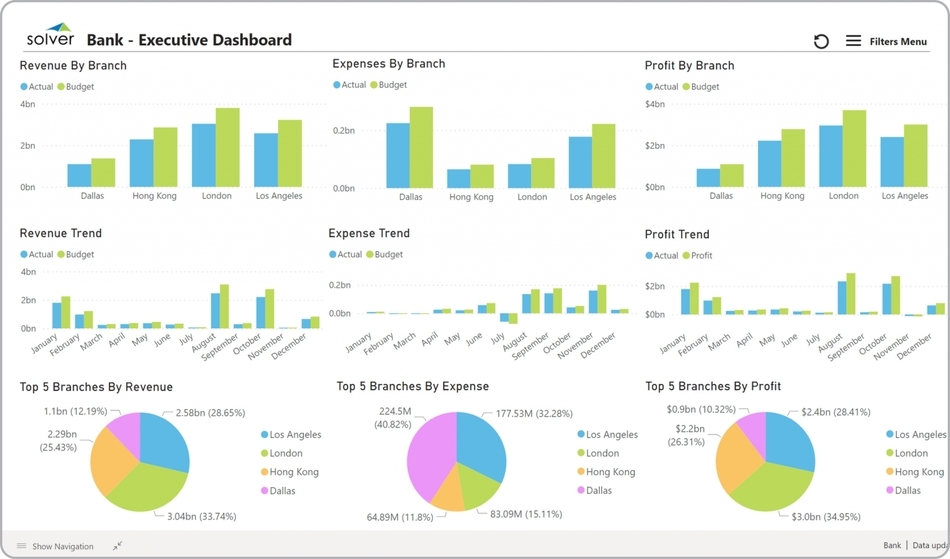
Example of a Executive Financial Dashboard Here is an example of an Executive Dashboard with bank branch comparisons as well as consolidated actual and budget trends.
Who Uses This Type of Dashboards? The typical users of this type of dashboards are: Executives, board members, CFOs. Other Reports Often Used in Conjunction with Executive Financial Dashboards Progressive Executive and Financial Planning & Analysis (FP&A) departments sometimes use several different Executive Dashboards, along with consolidated and branch-level profit & loss reports, balance sheets, cash flow statements, detailed operating dashboards, and other management and control tools.
Where Does the Data for Analysis Originate From? The Actual (historical transactions) data typically comes from loan management software and enterprise resource planning (ERP) systems like: Microsoft Dynamics 365 (D365) Finance, Microsoft Dynamics 365 Business Central (D365 BC), Microsoft Dynamics AX, Microsoft Dynamics NAV, Microsoft Dynamics GP, Microsoft Dynamics SL, Sage Intacct, Sage 100, Sage 300, Sage 500, Sage X3, SAP Business One, SAP ByDesign, Acumatica, Netsuite and others. In analyses where budgets or forecasts are used, the planning data most often originates from in-house Excel spreadsheet models or from professional xFP&A solutions.
What Tools are Typically used for Reporting, Planning and Dashboards? Examples of business software used with the data and ERPs mentioned above are:
- Native ERP report writers and query tools
- Spreadsheets (for example Microsoft Excel)
- extended financial planning and analysis (xFP&A) tools (for example Solver)
- Dashboards (for example Microsoft Power BI and Tableau)
To learn more, visit the Resource Library.
TAGS: Reporting, Planning, Forecasting, Analysis, Budgeting, FP&A, KPIs, ERP, Dashboards, Financial Reporting, Template Library