


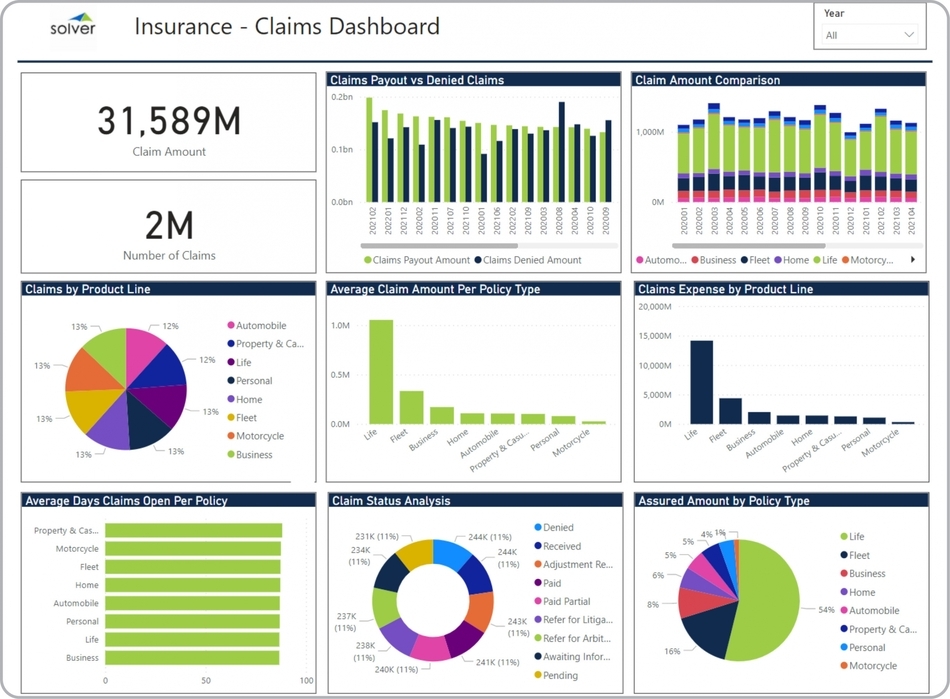
Purpose of Insurance Claims Dashboards Insurance companies use Insurance Claims Dashboards to give their managers and executives an easy way to monitor the health of claims activities. When used as part of good business practices in Claims and Finance departments, an organization can improve its claims strategies and related bottom line, and it can reduce the chances that leaders don't have a clear picture of claims trends and results. Example of a Insurance Claims Dashboard Here is an example of a Claims Dashboard with key trends and KPIs.
Who Uses This Type of Dashboard? The typical users of this type of dashboard are: Claims Managers, Executives, Analysts. Other Reports Often Used in Conjunction with Insurance Claims Dashboards Progressive Claims and Finance departments sometimes use several different Insurance Claims Dashboards, along with claims reports, financial dashboards, financial statements, budget models, forecasts and other management and control tools.
Where Does the Data for Analysis Originate From? The Actual (historical transactions) data typically comes from enterprise resource planning (ERP) systems like: Microsoft Dynamics 365 (D365) Finance, Microsoft Dynamics 365 Business Central (D365 BC), Microsoft Dynamics AX, Microsoft Dynamics NAV, Microsoft Dynamics GP, Microsoft Dynamics SL, Sage Intacct, Sage 100, Sage 300, Sage 500, Sage X3, SAP Business One, SAP ByDesign, Acumatica, Netsuite and others. In analyses where budgets or forecasts are used, the planning data most often originates from in-house Excel spreadsheet models or from professional xFP&A solutions.
What Tools are Typically used for Reporting, Planning and Dashboards? Examples of business software used with the data and ERPs mentioned above are:
- Native ERP report writers and query tools
- Spreadsheets (for example Microsoft Excel)
- xFP&A tools (for example Solver)
- Dashboards (for example Microsoft Power BI and Tableau)


To learn more, visit the Resource Library.
TAGS: Reporting, Planning, Forecasting, Analysis, Budgeting, FP&A, KPIs, ERP, Dashboards, Industry, Financial Reporting, Template Library