

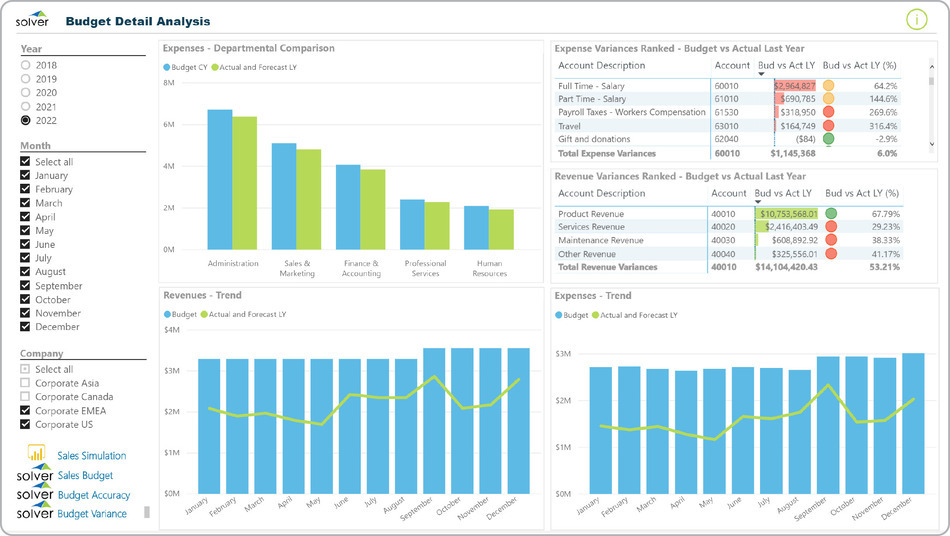
What is a Budget Detail Dashboard? Budget Detail Dashboards are considered planning analysis tools and are used by budget managers and executives to review completed budgets before and after final approval. Some of the main functionality in this type of dashboard is that it offers a lot of valuable budgetary information presented on a single screen. The left side of the dashboard provides filters for year, month and company. Below the filters you find links that opens various budget transaction reports as well as a sales simulation dashboard. There are five graphical components on the dashboard: 1) Actual versus budgeted expenses by department, 2) Actual and budget revenue trend, 3) Actual and budget expense trend, 4) Expense variances by account, ranked from high to low, and 5) Revenue variances by account. You find an example of this type of dashboard below.
Purpose of Budget Detail Dashboards Companies use Budget Detail Dashboards to give executives a very easy and interactive way to analyze a budget all the way down to the GL account level. When used as part of good business practices in a Financial Planning & Analysis (FP&A) department, an organization can improve and speed up its budget review and approval process, and it can reduce the chances that major budget issues are missed due to lack of management analysis.
Budget Detail Dashboard Example Here is an example of a Budget Detail Dashboard.

Who Uses This Type of Dashboard? The typical users of this type of dashboard are: Executives, CFOs, budget managers. Other Dashboards Often Used in Conjunction with Budget Detail Dashboards Progressive Financial Planning & Analysis (FP&A) departments sometimes use several different Budget Detail Dashboards, along with budget input models, budget summary dashboards, financial statements with trended budget figures and other management and control tools.
Where Does the Data for Analysis Originate From? The Actual (historical transactions) data typically comes from enterprise resource planning (ERP) systems like: Microsoft Dynamics 365 (D365) Finance, Microsoft Dynamics 365 Business Central (D365 BC), Microsoft Dynamics AX, Microsoft Dynamics NAV, Microsoft Dynamics GP, Microsoft Dynamics SL, Sage Intacct, Sage 100, Sage 300, Sage 500, Sage X3, SAP Business One, SAP ByDesign, Acumatica, Netsuite and others. In analyses where budgets or forecasts are used, the planning data most often originates from in-house Excel spreadsheet models or from professional xFP&A solutions.
What Tools are Typically used for Reporting, Planning and Dashboards? Examples of business software used with the data and ERPs mentioned above are:
Purpose of Budget Detail Dashboards Companies use Budget Detail Dashboards to give executives a very easy and interactive way to analyze a budget all the way down to the GL account level. When used as part of good business practices in a Financial Planning & Analysis (FP&A) department, an organization can improve and speed up its budget review and approval process, and it can reduce the chances that major budget issues are missed due to lack of management analysis.
Budget Detail Dashboard Example Here is an example of a Budget Detail Dashboard.
Who Uses This Type of Dashboard? The typical users of this type of dashboard are: Executives, CFOs, budget managers. Other Dashboards Often Used in Conjunction with Budget Detail Dashboards Progressive Financial Planning & Analysis (FP&A) departments sometimes use several different Budget Detail Dashboards, along with budget input models, budget summary dashboards, financial statements with trended budget figures and other management and control tools.
Where Does the Data for Analysis Originate From? The Actual (historical transactions) data typically comes from enterprise resource planning (ERP) systems like: Microsoft Dynamics 365 (D365) Finance, Microsoft Dynamics 365 Business Central (D365 BC), Microsoft Dynamics AX, Microsoft Dynamics NAV, Microsoft Dynamics GP, Microsoft Dynamics SL, Sage Intacct, Sage 100, Sage 300, Sage 500, Sage X3, SAP Business One, SAP ByDesign, Acumatica, Netsuite and others. In analyses where budgets or forecasts are used, the planning data most often originates from in-house Excel spreadsheet models or from professional xFP&A solutions.
What Tools are Typically used for Reporting, Planning and Dashboards? Examples of business software used with the data and ERPs mentioned above are:
- Native ERP report writers and query tools
- Spreadsheets (for example Microsoft Excel)
- extended financial planning and analysis (xFP&A) tools (for example Solver)
- Dashboards (for example Microsoft Power BI and Tableau)
To learn more, visit the Resource Library.