

Solver Marketplace
Explore based on functionality (reports, planning, and dashboard templates), or use the search function to filter by integration, industry, or to find a template that fits your specific needs. Save templates to your favorites list and use the "Share Favorites" link to share the list with others.
Icon Legend:
💲 Requires consulting hours to set up and configure
⭐ Save as a favorite and share with others
FUNCTIONALITY
- Reports
- Planning
- Dashboard
Data Source
Marketplace Data Source: Filter by Data Source to find assets specific to your system
Showcase Data Source: Filter by Data Source to find assets specific to your system
Industries
Marketplace Industries: Filter by Industries to find assets specific to your system
Showcase Industries: Filter by Industries to find assets specific to your system
industries
Marketplace Industries: Filter by your industry to find assets created for your specific needs
Showcase Industries: Filter by your industry to find assets created for your specific needs
475 - 480 of 868 Results
Favorite Page Results
Favorites


Reports
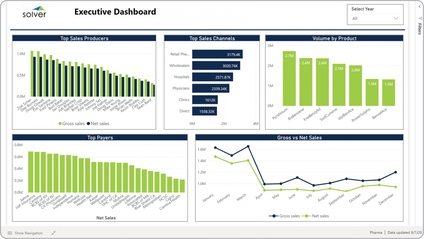
Pharma – Executive Dashboard
It provides analysis from five different perspectives, including:. Top sales producers with ranked gross sales and net sales,. Top sales channels,.
$
Dashboard
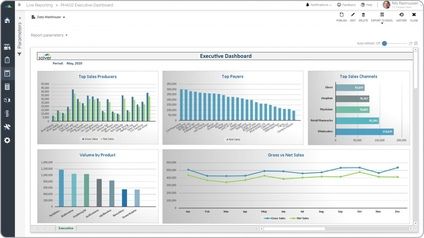
Pharma – Executive Power BI Dashboard
It provides a single screen to analyze business KPIs from five different perspectives:. Top sales producers ranked by gross and net sales,. Revenues from the top sales channels,.
$
Reports
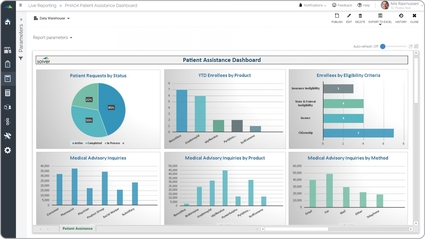
Pharma – Patient Assistance Dashboard
Tracks patient assistance program metrics including applications, approvals, costs, and drug utilization by therapy area. Helps pharmaceutical finance and compliance teams monitor program spend.
$
Dashboard
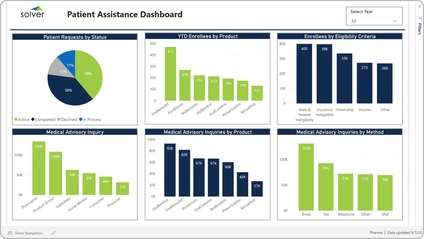
Pharma – Patient Dashboard
It offers key insights that measures program performance from six different perspectives:. Patient request by status (active, completed, declined, in process),.
$
Reports
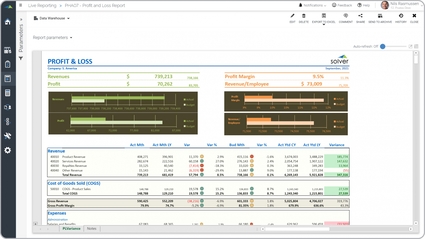
Pharma – Profit & Loss Report
Profit & Loss (P&L) It is parameter driven and combines a classic P&L layout with charts that highlight the KPIs in the report.
$
Reports
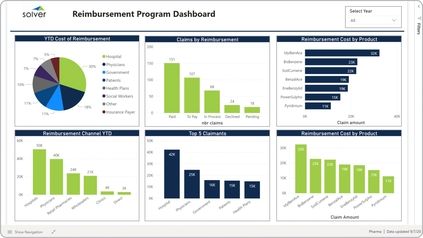
Pharma – Reimbursement Dashboard
It provides graphical analysis of five key performance indicators (KPIs), including:. Year-to-date (YTD) costs of reimbursement requests,.
$