

Solver Marketplace
Explore based on functionality (reports, planning, and dashboard templates), or use the search function to filter by integration, industry, or to find a template that fits your specific needs. Save templates to your favorites list and use the "Share Favorites" link to share the list with others.
Icon Legend:
💲 Requires consulting hours to set up and configure
⭐ Save as a favorite and share with others
FUNCTIONALITY
- Reports
- Planning
- Dashboard
Data Source
Marketplace Data Source: Filter by Data Source to find assets specific to your system
Showcase Data Source: Filter by Data Source to find assets specific to your system
Industries
Marketplace Industries: Filter by Industries to find assets specific to your system
Showcase Industries: Filter by Industries to find assets specific to your system
industries
Marketplace Industries: Filter by your industry to find assets created for your specific needs
Showcase Industries: Filter by your industry to find assets created for your specific needs
343 - 348 of 868 Results
Favorite Page Results
Favorites


Reports
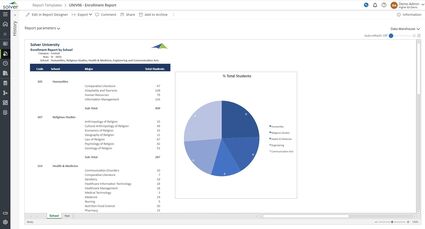
Higher Ed – Enrollment by School
It uses data from the student information system and can be filtered based on parameters such as school and semester (quarter).
$
Reports
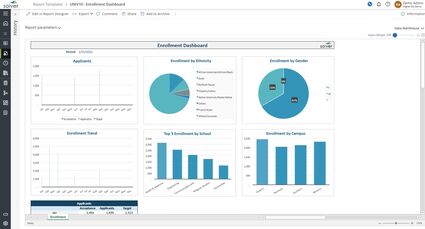
Higher Ed – Enrollment Dashboard
Some of the main functionality visualization report is that it provides insight into student statistics from six different KPI perspectives:. Applicants by semester/quarter,. Enrollment by ethnicity,.
$
Dashboard
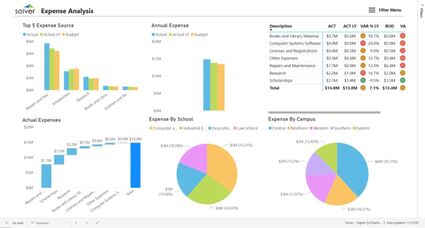
Higher Ed – Expense Analysis
It provides simple way to analyze operating expenses from six different perspectives.
$
Planning
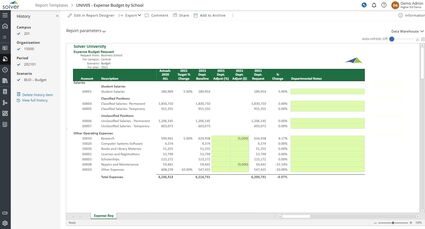
Higher Ed – Expense Budget Request
Key functionality input form automatically displays the summary of the salary budget (entered in a separate, detailed employee template) and provides input for all other expenses.
$
Dashboard
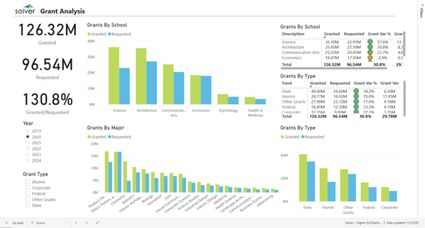
Higher Ed – Grant Analysis
Grant Dashboard for Higher Education Institutions What is a Grant Dashboard ? It enables analysis of grants from six different perspectives.
$
Reports
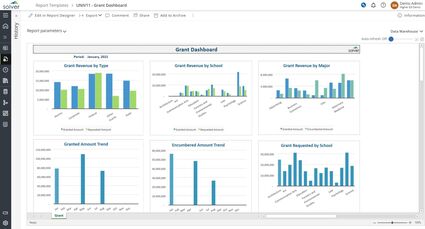
Higher Ed – Grant Dashboard
Some of the main functionality visualization report is that it gives six graphical views of important KPIs in this area. Granted vs requested revenue by type,. Granted vs requested revenue by school,.
$