

Solver Marketplace
Explore based on functionality (reports, planning, and dashboard templates), or use the search function to filter by integration, industry, or to find a template that fits your specific needs. Save templates to your favorites list and use the "Share Favorites" link to share the list with others.
Icon Legend:
💲 Requires consulting hours to set up and configure
⭐ Save as a favorite and share with others
FUNCTIONALITY
- Reports
- Planning
- Dashboard
Data Source
Marketplace Data Source: Filter by Data Source to find assets specific to your system
Showcase Data Source: Filter by Data Source to find assets specific to your system
Industries
Marketplace Industries: Filter by Industries to find assets specific to your system
Showcase Industries: Filter by Industries to find assets specific to your system
industries
Marketplace Industries: Filter by your industry to find assets created for your specific needs
Showcase Industries: Filter by your industry to find assets created for your specific needs
331 - 336 of 868 Results
Favorite Page Results
Favorites


Reports
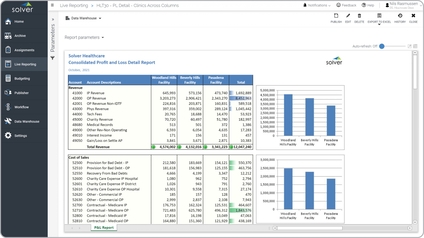
Healthcare – Profit & Loss with Clinics
Consolidated profit & loss (P&L) It is parameter driven and the user can run it for divisions as well as the top consolidated level in the organization.
$
Planning
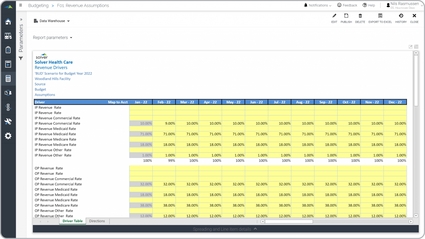
Healthcare – Revenue Budget Assumptions
Revenue Assumption input forms are considered budget drivers and are often used by budget managers to automatically calculate revenue amounts for the healthcare provider.
$
Reports
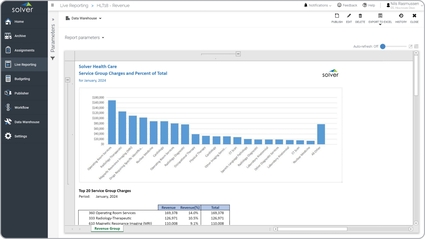
Healthcare – Revenue by Service Group
It automatically ranks the top twenty service groups by revenue.
$
Dashboard
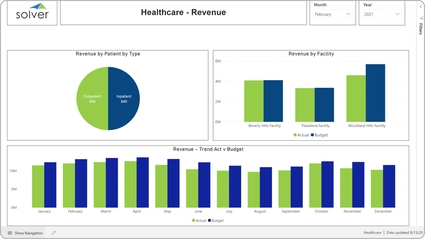
Healthcare – Revenue Dashboard
Revenue Dashboards for healthcare providers are considered performance analysis tools and are used by Executives and CFOs to monitor revenues metrics.
$
Planning
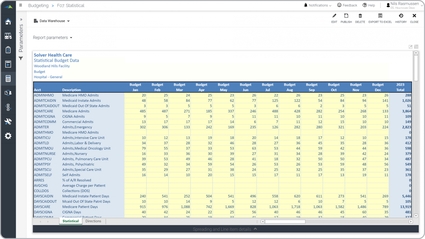
Healthcare – Statistical Budget
Some of the main functionality input template is that it is parameter driven so each department can enter their own data and there can be multiple budget or forecast versions.
$
Dashboard
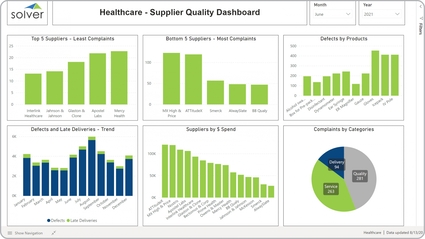
Healthcare – Supplier Quality Dashboard
It provides analysis from these six perspectives:. Top five suppliers with the least complaints,. Bottom five suppliers with the most complaints,.
$