

Solver Marketplace
Explore based on functionality (reports, planning, and dashboard templates), or use the search function to filter by integration, industry, or to find a template that fits your specific needs. Save templates to your favorites list and use the "Share Favorites" link to share the list with others.
Icon Legend:
💲 Requires consulting hours to set up and configure
⭐ Save as a favorite and share with others
FUNCTIONALITY
- Reports
- Planning
- Dashboard
Data Source
Marketplace Data Source: Filter by Data Source to find assets specific to your system
Showcase Data Source: Filter by Data Source to find assets specific to your system
Industries
Marketplace Industries: Filter by Industries to find assets specific to your system
Showcase Industries: Filter by Industries to find assets specific to your system
industries
Marketplace Industries: Filter by your industry to find assets created for your specific needs
Showcase Industries: Filter by your industry to find assets created for your specific needs
337 - 342 of 868 Results
Favorite Page Results
Favorites


Reports
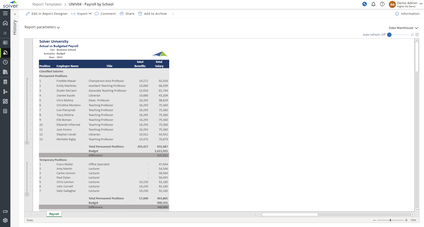
Higher Ed – Actual vs Budget Payroll
It it groups employees in two main categories and presents the actual salaries with a comparison to the budget and displays the difference.
$
Planning
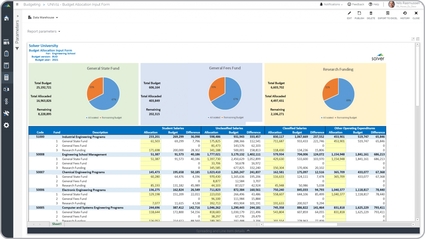
Higher Ed – Allocations to Funds
Some of the main functionality input form is that it it lists expense account categories across the columns and funds grouped by program down the rows.
$
Reports
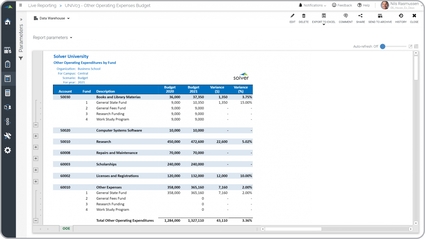
Higher Ed – Budget Comparison
It it shows the differences between two annual budgets and displays these both as amounts and in percent.
$
Planning
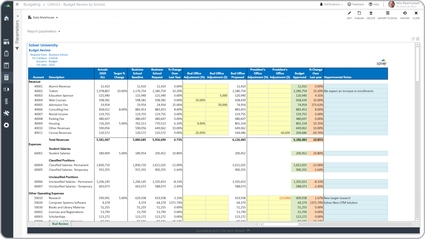
Higher Ed – Budget Review
Key functionality input form shows the requested revenues and expenses for a department/school and then allows for adjustments.
$
Planning
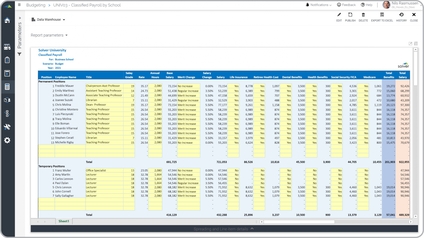
Higher Ed – Classified Payroll Budget
Classified Payroll Budgets are considered employee budget models and are used by budget managers to plan for all classified salary and benefit related personnel expenses.
$
Dashboard
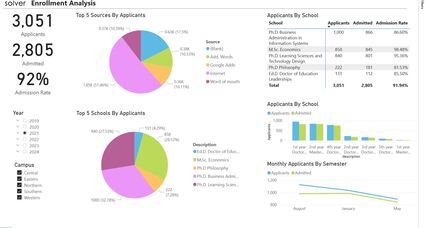
Higher Ed – Enrollment Analysis
It enables analysis of the incoming student population from six different perspectives:. KPIs with Total applicants, Admitted students, and Admission rate (%),.
$