

Solver Marketplace
Explore based on functionality (reports, planning, and dashboard templates), or use the search function to filter by integration, industry, or to find a template that fits your specific needs. Save templates to your favorites list and use the "Share Favorites" link to share the list with others.
Icon Legend:
💲 Requires consulting hours to set up and configure
⭐ Save as a favorite and share with others
FUNCTIONALITY
- Reports
- Planning
- Dashboard
Data Source
Marketplace Data Source: Filter by Data Source to find assets specific to your system
Showcase Data Source: Filter by Data Source to find assets specific to your system
Industries
Marketplace Industries: Filter by Industries to find assets specific to your system
Showcase Industries: Filter by Industries to find assets specific to your system
industries
Marketplace Industries: Filter by your industry to find assets created for your specific needs
Showcase Industries: Filter by your industry to find assets created for your specific needs
541 - 546 of 868 Results
Favorite Page Results
Favorites


Dashboard
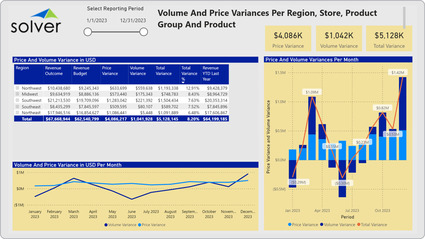
Retail – Volume & Price per Region and Store
Sales Dashboards with store and product detail are considered sales analysis tools and are used by regional managers and product managers to analyze the main reasons store/region and item sales are above or below budget.
$
Planning
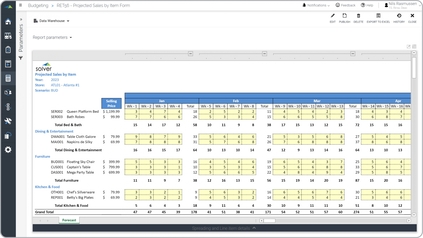
Retail – Weekly Sales Forecast
A key functionality template allows the sales manager to automatically generate sales per sales person based on break-back of the full year sales target. Next, manual adjustments can be made at the row level to apply relevant exceptions.
$
Reports
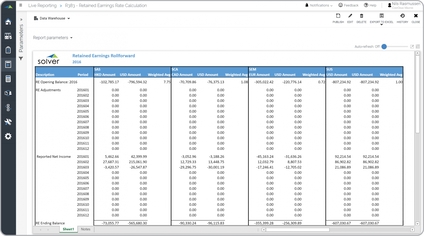
Retained Earnings Report
Some of the key functionality calculates the required currency translation rate for the Retained Earnings (RE) opening balance at the beginning of the new fiscal year.
$
Reports
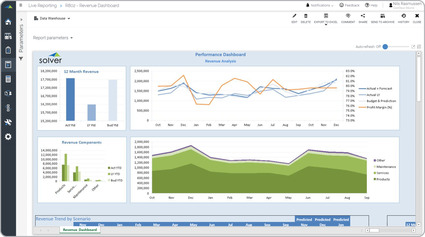
Revenue – Rolling Trend Analysis
A key functionality report dynamically displays the past 15 months of revenues. It also shows column charts for the current fiscal year compared to last year and budgets. Furthermore, it displays a ranked list of each major revenue component.
$
Dashboard
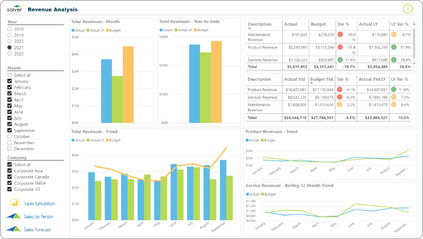
Revenue Analysis
Power BI dashboard showing analysis of actual and budget revenues by month and trended.
$
Reports
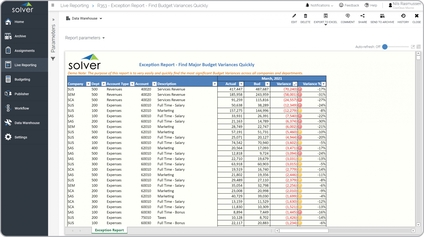
Revenue and Expense Exception Report
It shows all key GL dimensions in the rows with their monthly balance for actual, budget and variance. This allows the user to see across all companies, departments and accounts in one single report.
$