

Solver Marketplace
Explore based on functionality (reports, planning, and dashboard templates), or use the search function to filter by integration, industry, or to find a template that fits your specific needs. Save templates to your favorites list and use the "Share Favorites" link to share the list with others.
Icon Legend:
💲 Requires consulting hours to set up and configure
⭐ Save as a favorite and share with others
FUNCTIONALITY
- Reports
- Planning
- Dashboard
Data Source
Marketplace Data Source: Filter by Data Source to find assets specific to your system
Showcase Data Source: Filter by Data Source to find assets specific to your system
Industries
Marketplace Industries: Filter by Industries to find assets specific to your system
Showcase Industries: Filter by Industries to find assets specific to your system
industries
Marketplace Industries: Filter by your industry to find assets created for your specific needs
Showcase Industries: Filter by your industry to find assets created for your specific needs
535 - 540 of 868 Results
Favorite Page Results
Favorites


Dashboard
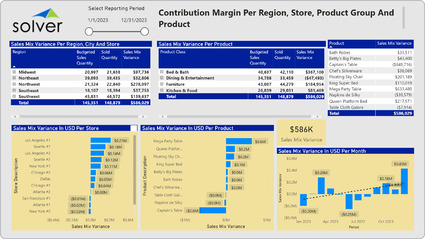
Retail – Sales Mix
It shows variances in sales mix across six different perspectives:. Sales mix variance by region, city and store,. Sales mix variance by product group and product,.
$
Reports
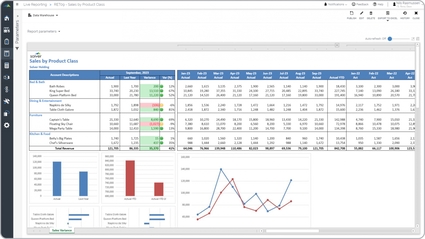
Retail – Sales Trend by Product
Shows monthly sales by product with variance analysis versus prior year.
$
Reports
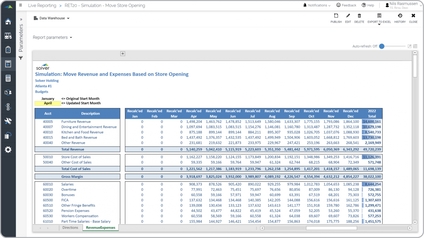
Retail – Simulation of Store Opening
Some of the main functionality model is that it allows the user to select data from a similar existing store that automatically will be pulled into the model.
$
Dashboard
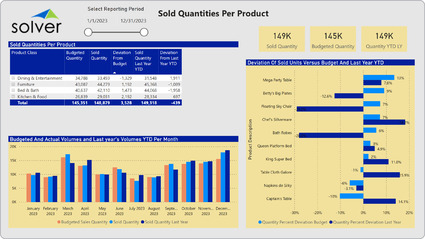
Retail – Sold Quantities per Product
It completely focused on product quantity metrics and provides analysis from these perspectives:.
$
Reports
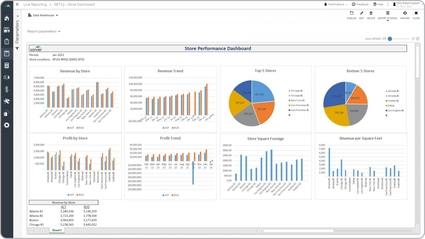
Retail – Store Performance Dashboard
It it compares actual and budget revenues and profit across stores. It also shows the monthly trend for these two metrics.
$
Dashboard
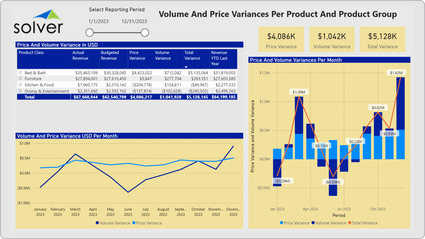
Retail – Volume & Price per Product
Product Sales Variance Dashboards for retail companies are considered sales analysis tools and are used by managers to analyze the main reasons product sales are above or below budget.
$