

Solver Marketplace
Explore based on functionality (reports, planning, and dashboard templates), or use the search function to filter by integration, industry, or to find a template that fits your specific needs. Save templates to your favorites list and use the "Share Favorites" link to share the list with others.
Icon Legend:
💲 Requires consulting hours to set up and configure
⭐ Save as a favorite and share with others
FUNCTIONALITY
- Reports
- Planning
- Dashboard
Data Source
Marketplace Data Source: Filter by Data Source to find assets specific to your system
Showcase Data Source: Filter by Data Source to find assets specific to your system
Industries
Marketplace Industries: Filter by Industries to find assets specific to your system
Showcase Industries: Filter by Industries to find assets specific to your system
industries
Marketplace Industries: Filter by your industry to find assets created for your specific needs
Showcase Industries: Filter by your industry to find assets created for your specific needs
505 - 510 of 868 Results
Favorite Page Results
Favorites


Planning
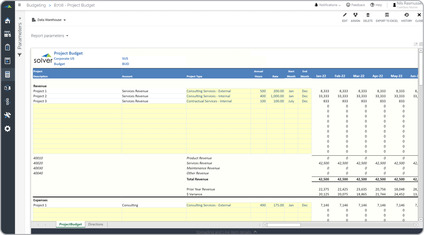
Project Budget
Some key functionality form allows the user to enter any number of projects, associate them with a Project Type, and capture key metrics like hours, rates and start/end dates.
$
Reports
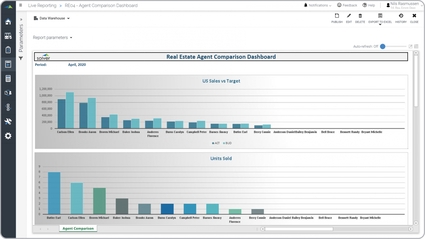
Real Estate – Agent Dashboard
Some of the main functionality graphical report is that it is parameter driven and displays sales metrics both graphically and as figures (below the chart section seen in the image below).
$
Reports
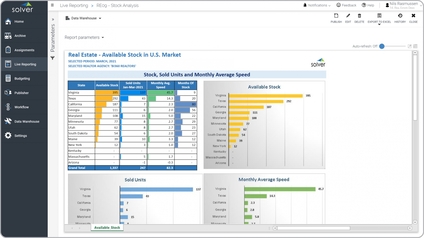
Real Estate – Available Stock Analysis
It provides four analytical perspectives with real estate KPIs, including:.
$
Reports
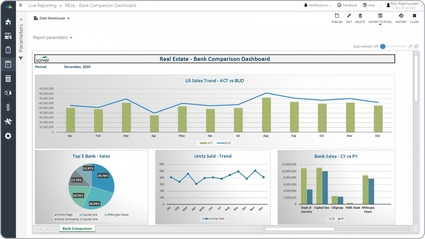
Real Estate – Bank Dashboard
It is run on a monthly basis and includes analysis from four different perspectives:. Monthly sales trend with actual compared to budget,. Units sold trend, and.
$
Reports
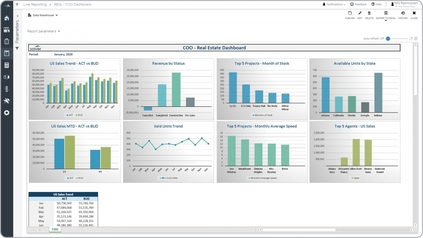
Real Estate – Executive Dashboard
Executive dashboards are considered decision-support tools and are used by real estate leaders to analyze trends and budget variances for key corporate metrics.
$
Dashboard
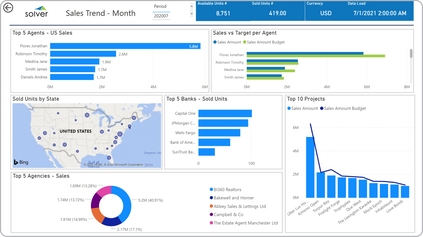
Real Estate – Monthly Sales
It enables easy sales monitoring using six charts as well as with KPIs.
$