

Solver Marketplace
Explore based on functionality (reports, planning, and dashboard templates), or use the search function to filter by integration, industry, or to find a template that fits your specific needs. Save templates to your favorites list and use the "Share Favorites" link to share the list with others.
Icon Legend:
💲 Requires consulting hours to set up and configure
⭐ Save as a favorite and share with others
FUNCTIONALITY
- Reports
- Planning
- Dashboard
Data Source
Marketplace Data Source: Filter by Data Source to find assets specific to your system
Showcase Data Source: Filter by Data Source to find assets specific to your system
Industries
Marketplace Industries: Filter by Industries to find assets specific to your system
Showcase Industries: Filter by Industries to find assets specific to your system
industries
Marketplace Industries: Filter by your industry to find assets created for your specific needs
Showcase Industries: Filter by your industry to find assets created for your specific needs
493 - 498 of 868 Results
Favorite Page Results
Favorites


Reports
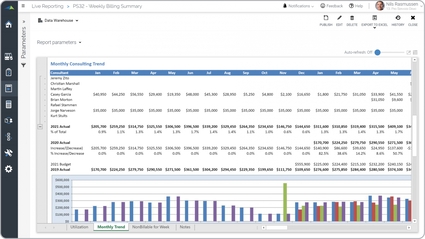
Professional Services – Monthly Billing Trend
It it can be run for any period and will dynamically display monthly data for the past five years as well as current year budget.
$
Planning
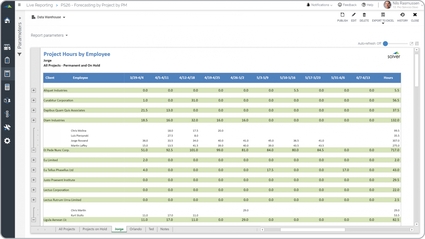
Professional Services – Project Forecast by Employee
Allows project managers to enter revenue and cost forecasts by employee and project directly in Solver. Supports billable utilization tracking and margin forecasting.
$
Reports
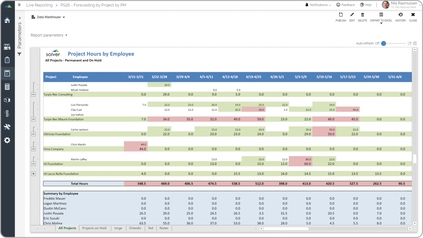
Professional Services – Project Forecast by PM
It dynamically displays hours by week across the columns and consultants grouped by project down the rows.
$
Dashboard
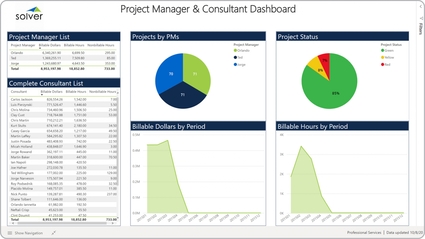
Professional Services – Project Manager and Consultants
It enables analysis of KPIs and other metrics from six different perspectives:.
$
Reports
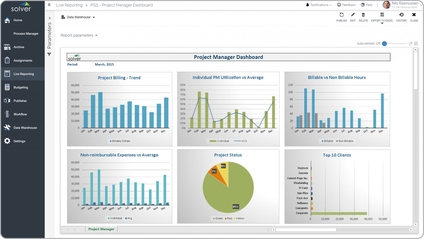
Professional Services – Project Manager Dashboard
It the user can run the report to get a snapshot of the current month or any historical period and all the data will update accordingly.
$
Reports
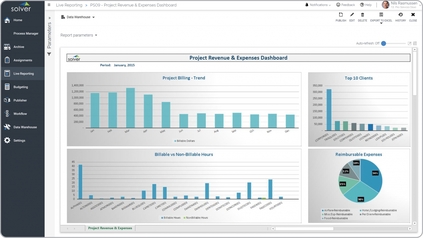
Professional Services – Project Revenue and Expenses
It is parameter driven and users can run it for any month and year to see relevant data. The four charts in the dashboards show:.
$