

Solver Marketplace
Explore based on functionality (reports, planning, and dashboard templates), or use the search function to filter by integration, industry, or to find a template that fits your specific needs. Save templates to your favorites list and use the "Share Favorites" link to share the list with others.
Icon Legend:
💲 Requires consulting hours to set up and configure
⭐ Save as a favorite and share with others
FUNCTIONALITY
- Reports
- Planning
- Dashboard
Data Source
Marketplace Data Source: Filter by Data Source to find assets specific to your system
Showcase Data Source: Filter by Data Source to find assets specific to your system
Industries
Marketplace Industries: Filter by Industries to find assets specific to your system
Showcase Industries: Filter by Industries to find assets specific to your system
industries
Marketplace Industries: Filter by your industry to find assets created for your specific needs
Showcase Industries: Filter by your industry to find assets created for your specific needs
307 - 312 of 868 Results
Favorite Page Results
Favorites


Dashboard
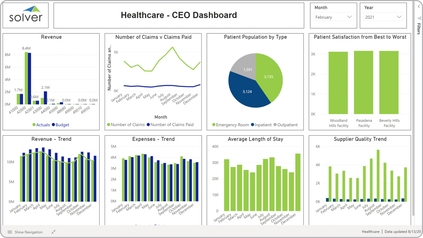
Healthcare – CEO Dashboard
It provides analysis from eight different perspectives, including:. Actual and budgeted revenues by GL account,. Monthly trend in number of claims versus claims paid,.
$
Dashboard
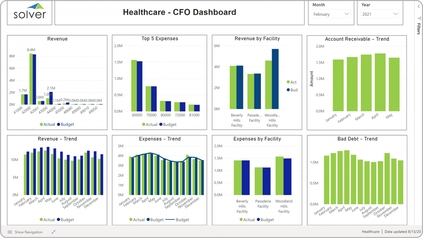
Healthcare – CFO Dashboard
Some of the main functionality in this dashboard is that it provides analysis from eight different perspectives, including:. Actual and budgeted revenues by GL account,. Top 5 expenses - actual and budget,.
$
Dashboard
Dashboard
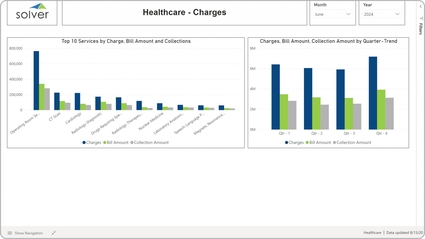
Healthcare – Charges Dashboard
It provides analysis from two perspectives:. Top 10 services ranked and compared to billed and collected amounts, and. Quarter by quarter comparison of charges, billings and collections.
$
Reports
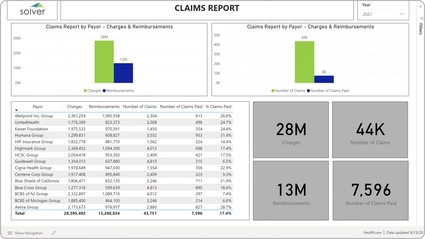
Healthcare – Claims Analysis
It uses KPIs, a matrix and charts to provide analysis in seven areas:. Total charges and reimbursement amounts,. Number of claims and claims paid,.
$
Reports
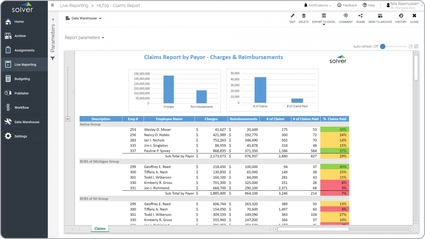
Healthcare – Claims by Payor
It shows claims-related information by employee and insurance provider (payor). The metrics include charges, reimbursements, # of claims, # of claims paid, and % of claims paid.
$