

Solver Marketplace
Explore based on functionality (reports, planning, and dashboard templates), or use the search function to filter by integration, industry, or to find a template that fits your specific needs. Save templates to your favorites list and use the "Share Favorites" link to share the list with others.
Icon Legend:
💲 Requires consulting hours to set up and configure
⭐ Save as a favorite and share with others
FUNCTIONALITY
- Reports
- Planning
- Dashboard
Data Source
Marketplace Data Source: Filter by Data Source to find assets specific to your system
Showcase Data Source: Filter by Data Source to find assets specific to your system
Industries
Marketplace Industries: Filter by Industries to find assets specific to your system
Showcase Industries: Filter by Industries to find assets specific to your system
industries
Marketplace Industries: Filter by your industry to find assets created for your specific needs
Showcase Industries: Filter by your industry to find assets created for your specific needs
97 - 102 of 873 Results
Favorite Page Results
Favorites


Reports
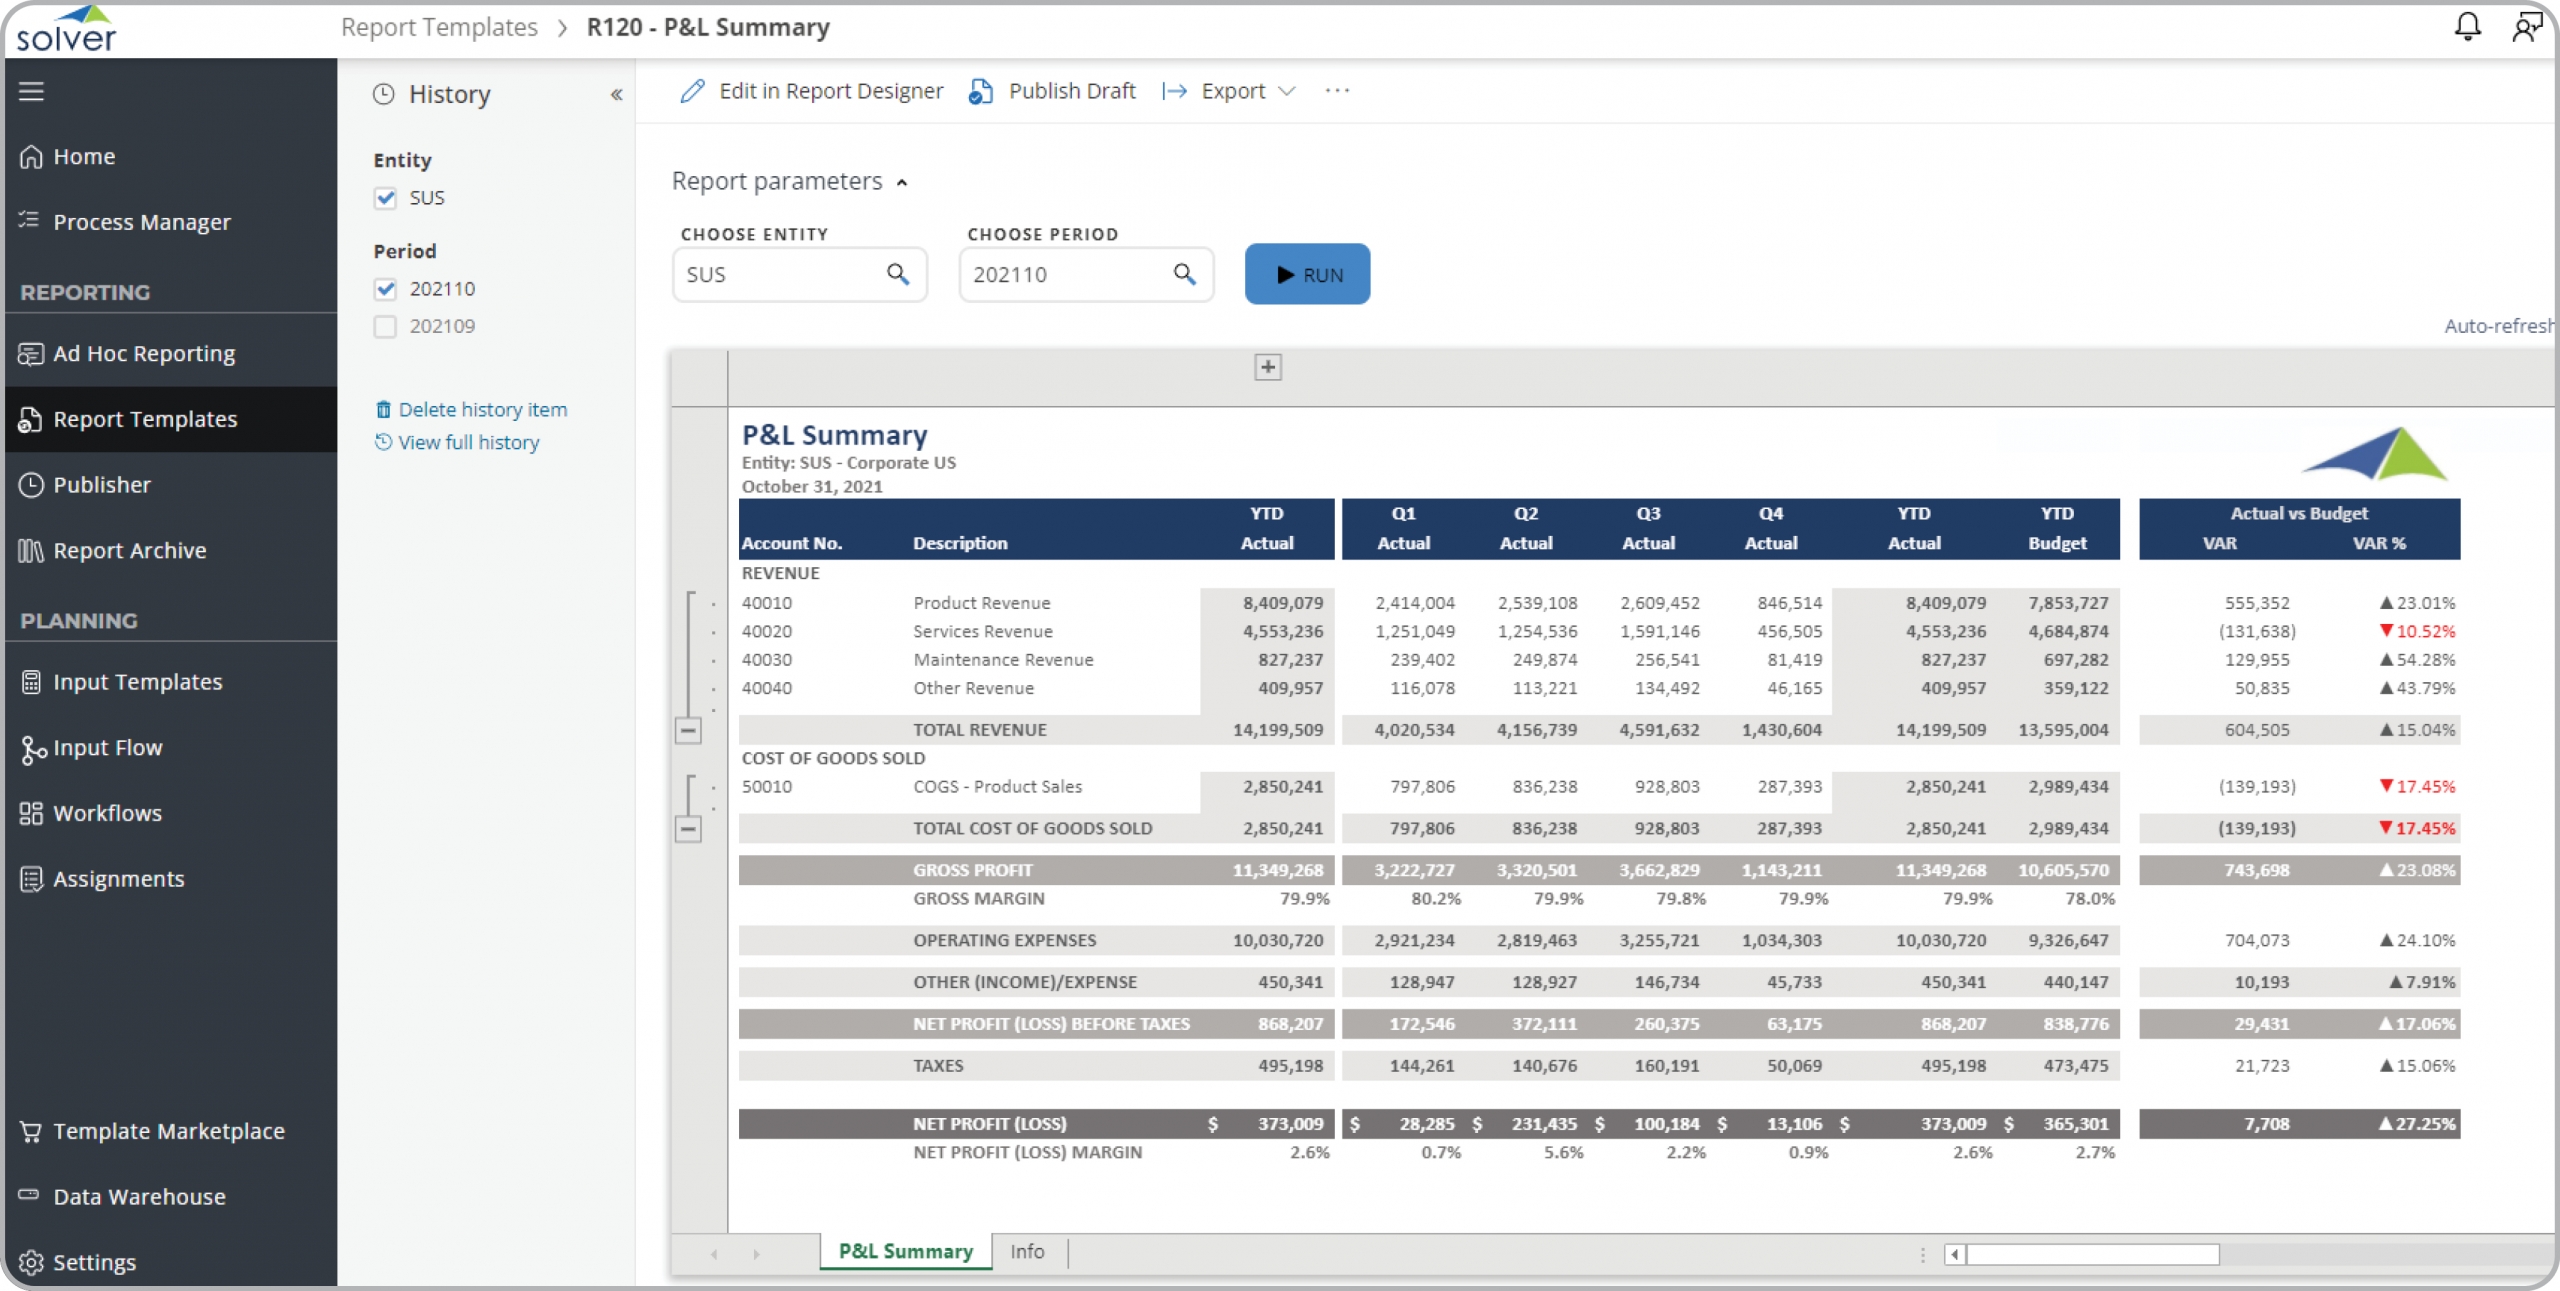
P&L Summary Level by Month and by Quarter
It gives CFOs, FP&A managers, and controllers fast, reliable access to the financial and operational insights they need — without custom development.
$
Reports
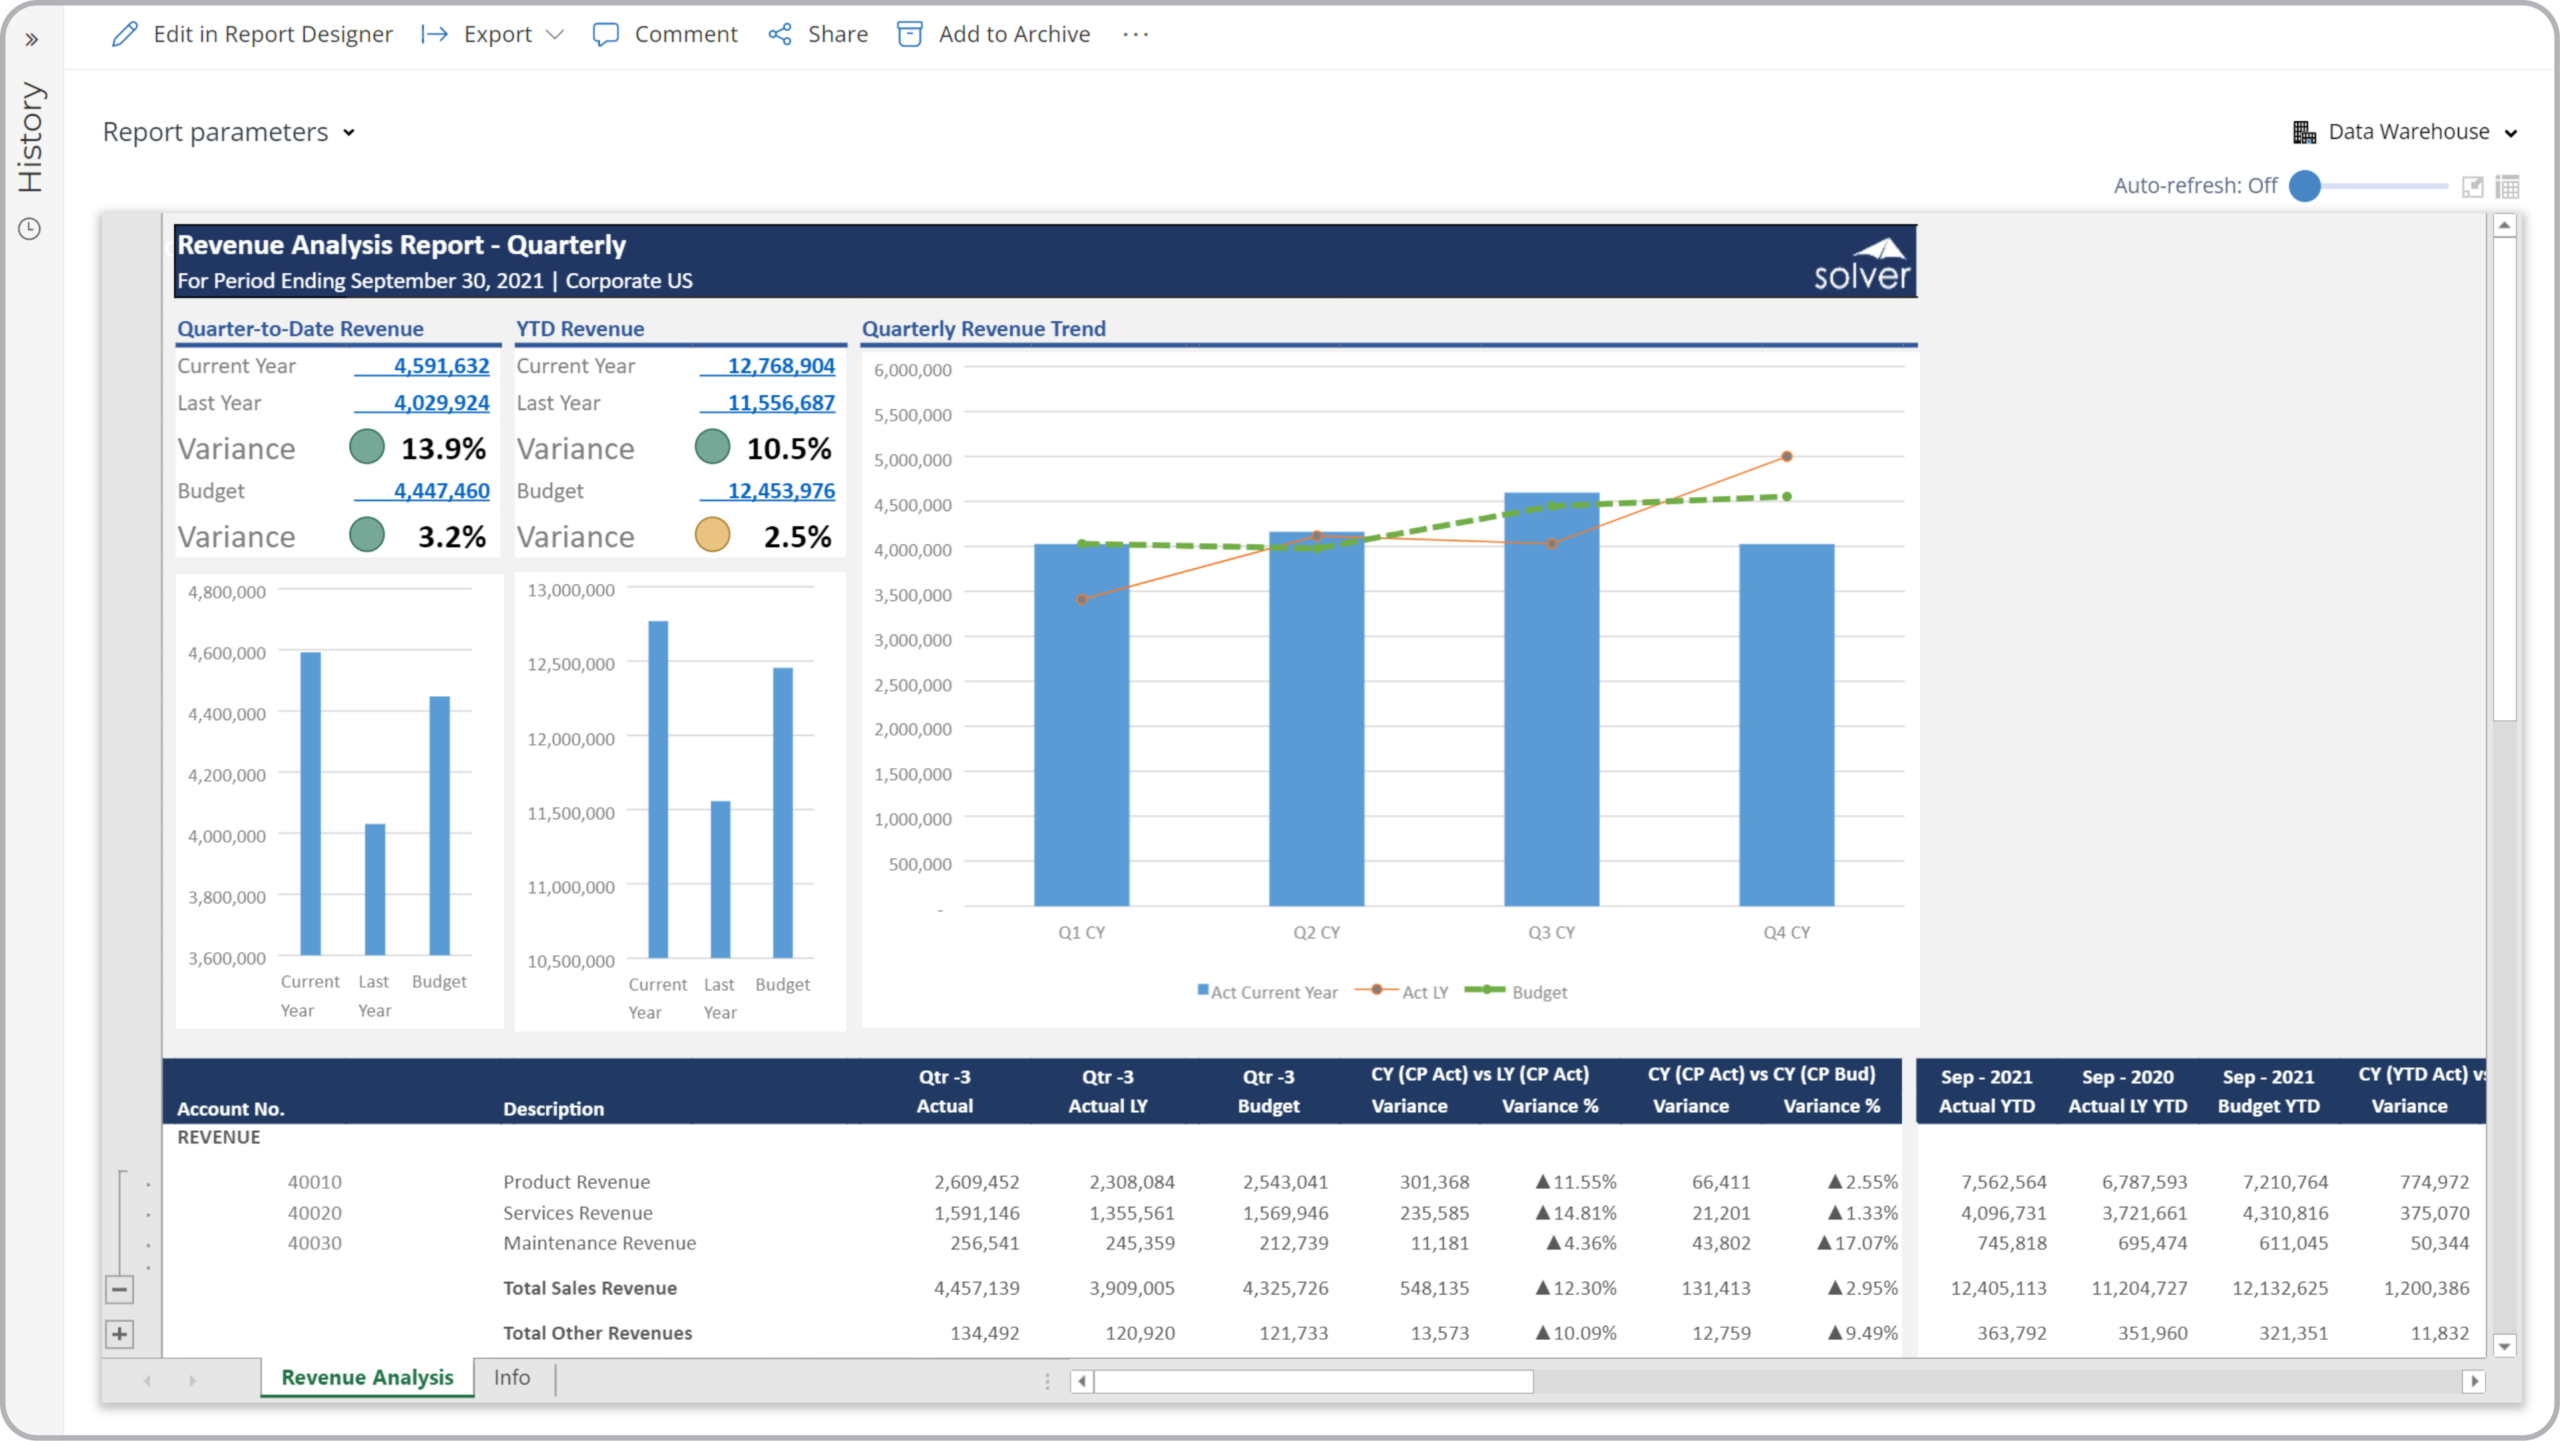
Revenue Analysis - Quarterly Actual and Budget Comparison
It gives CFOs, FP&A managers, and budget owners fast, reliable access to the financial and operational insights they need — without custom development.
$
Reports
P&L Variance Report
It gives CFOs, FP&A managers, and controllers fast, reliable access to the financial and operational insights they need — without custom development.
$
Reports
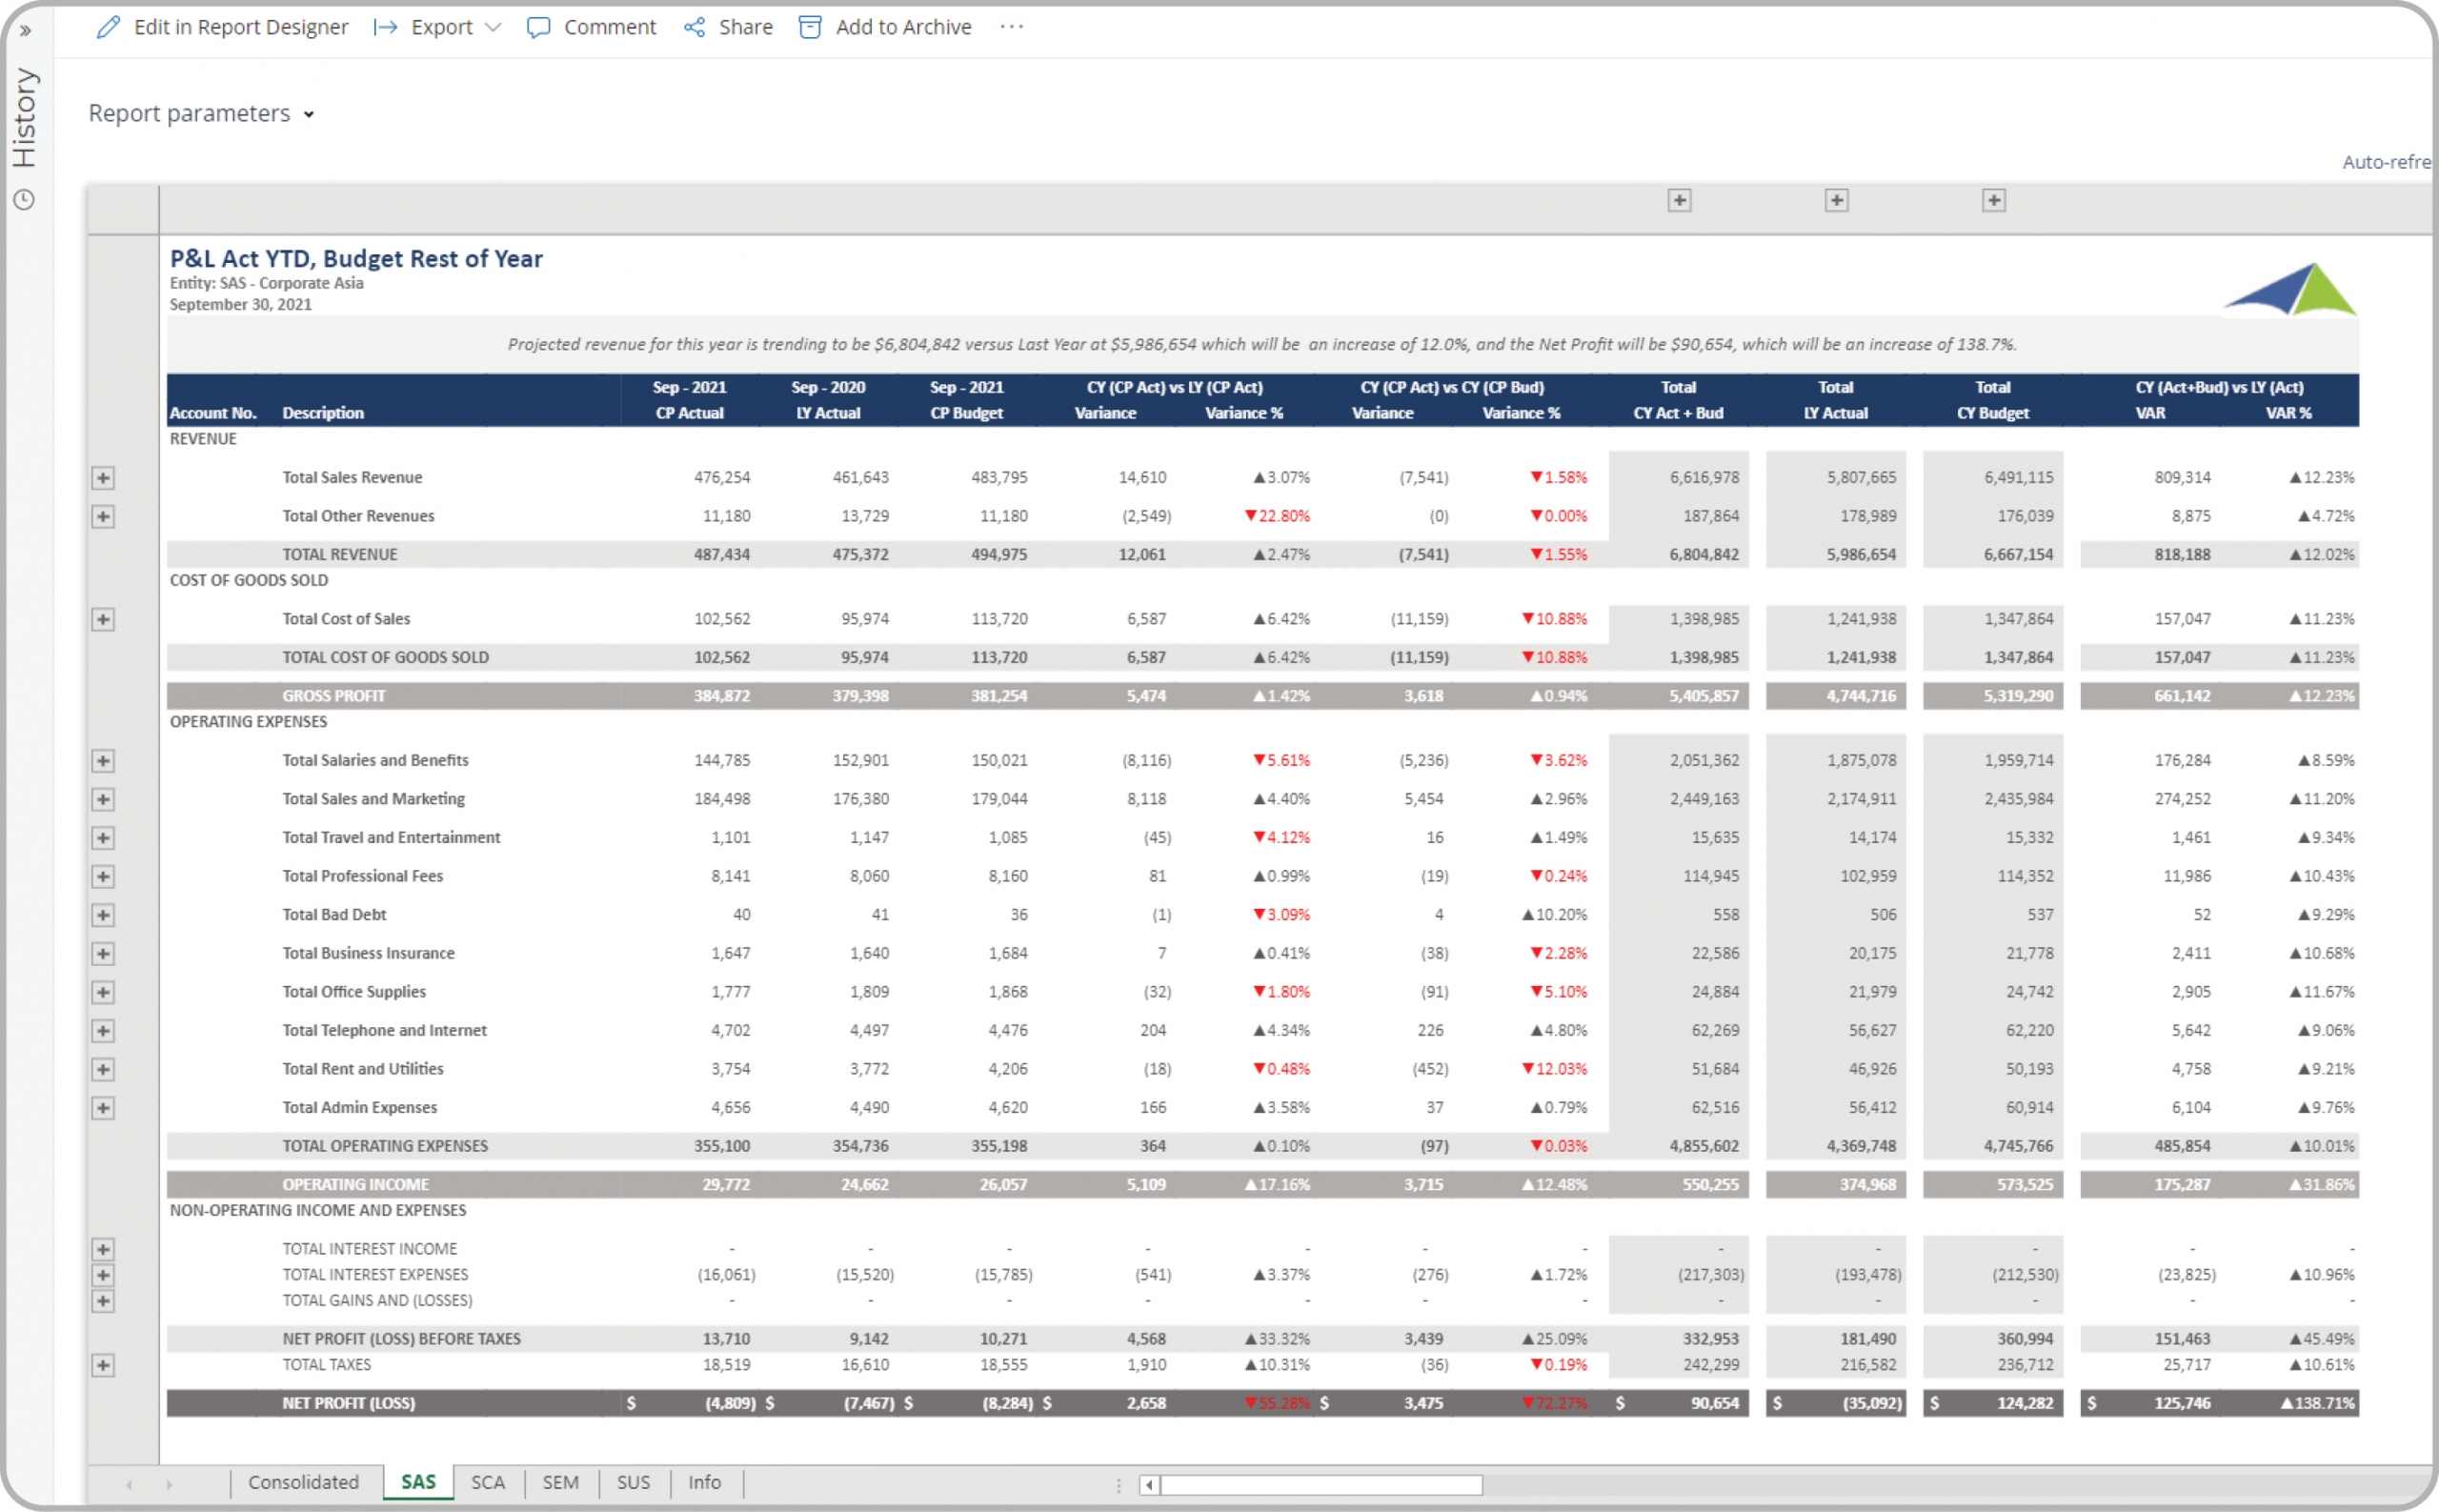
P&L Variance with Consolidation & SPV Entity
P&L Consolidation Reports with Multi-tabs to Streamline the Monthly Reporting Process.
$
Reports
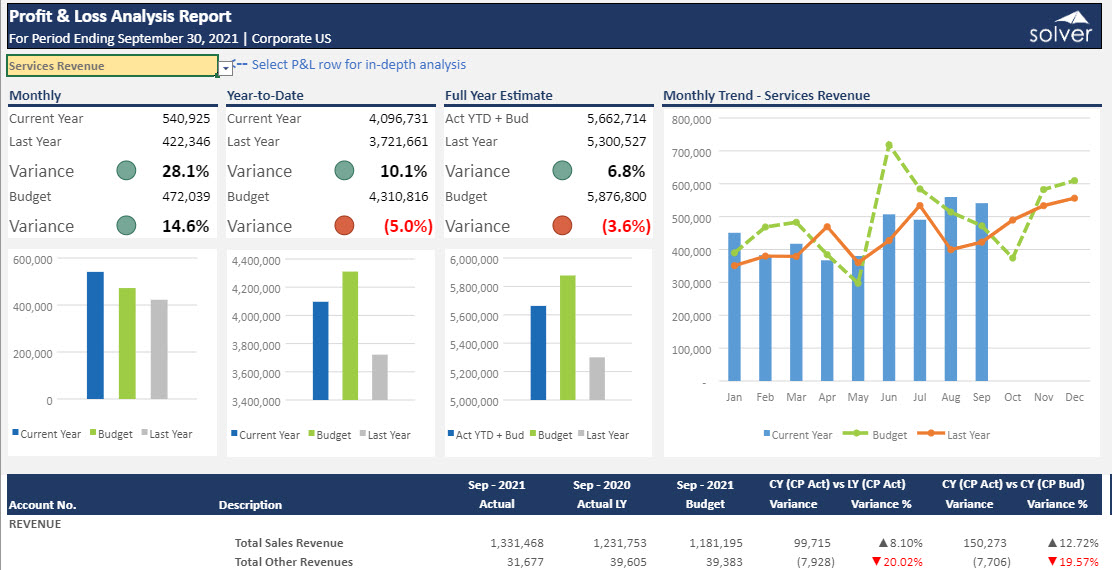
Profit & Loss Analysis - In-dept by row
It gives CFOs, FP&A managers, and controllers fast, reliable access to the financial and operational insights they need — without custom development.
$
Reports
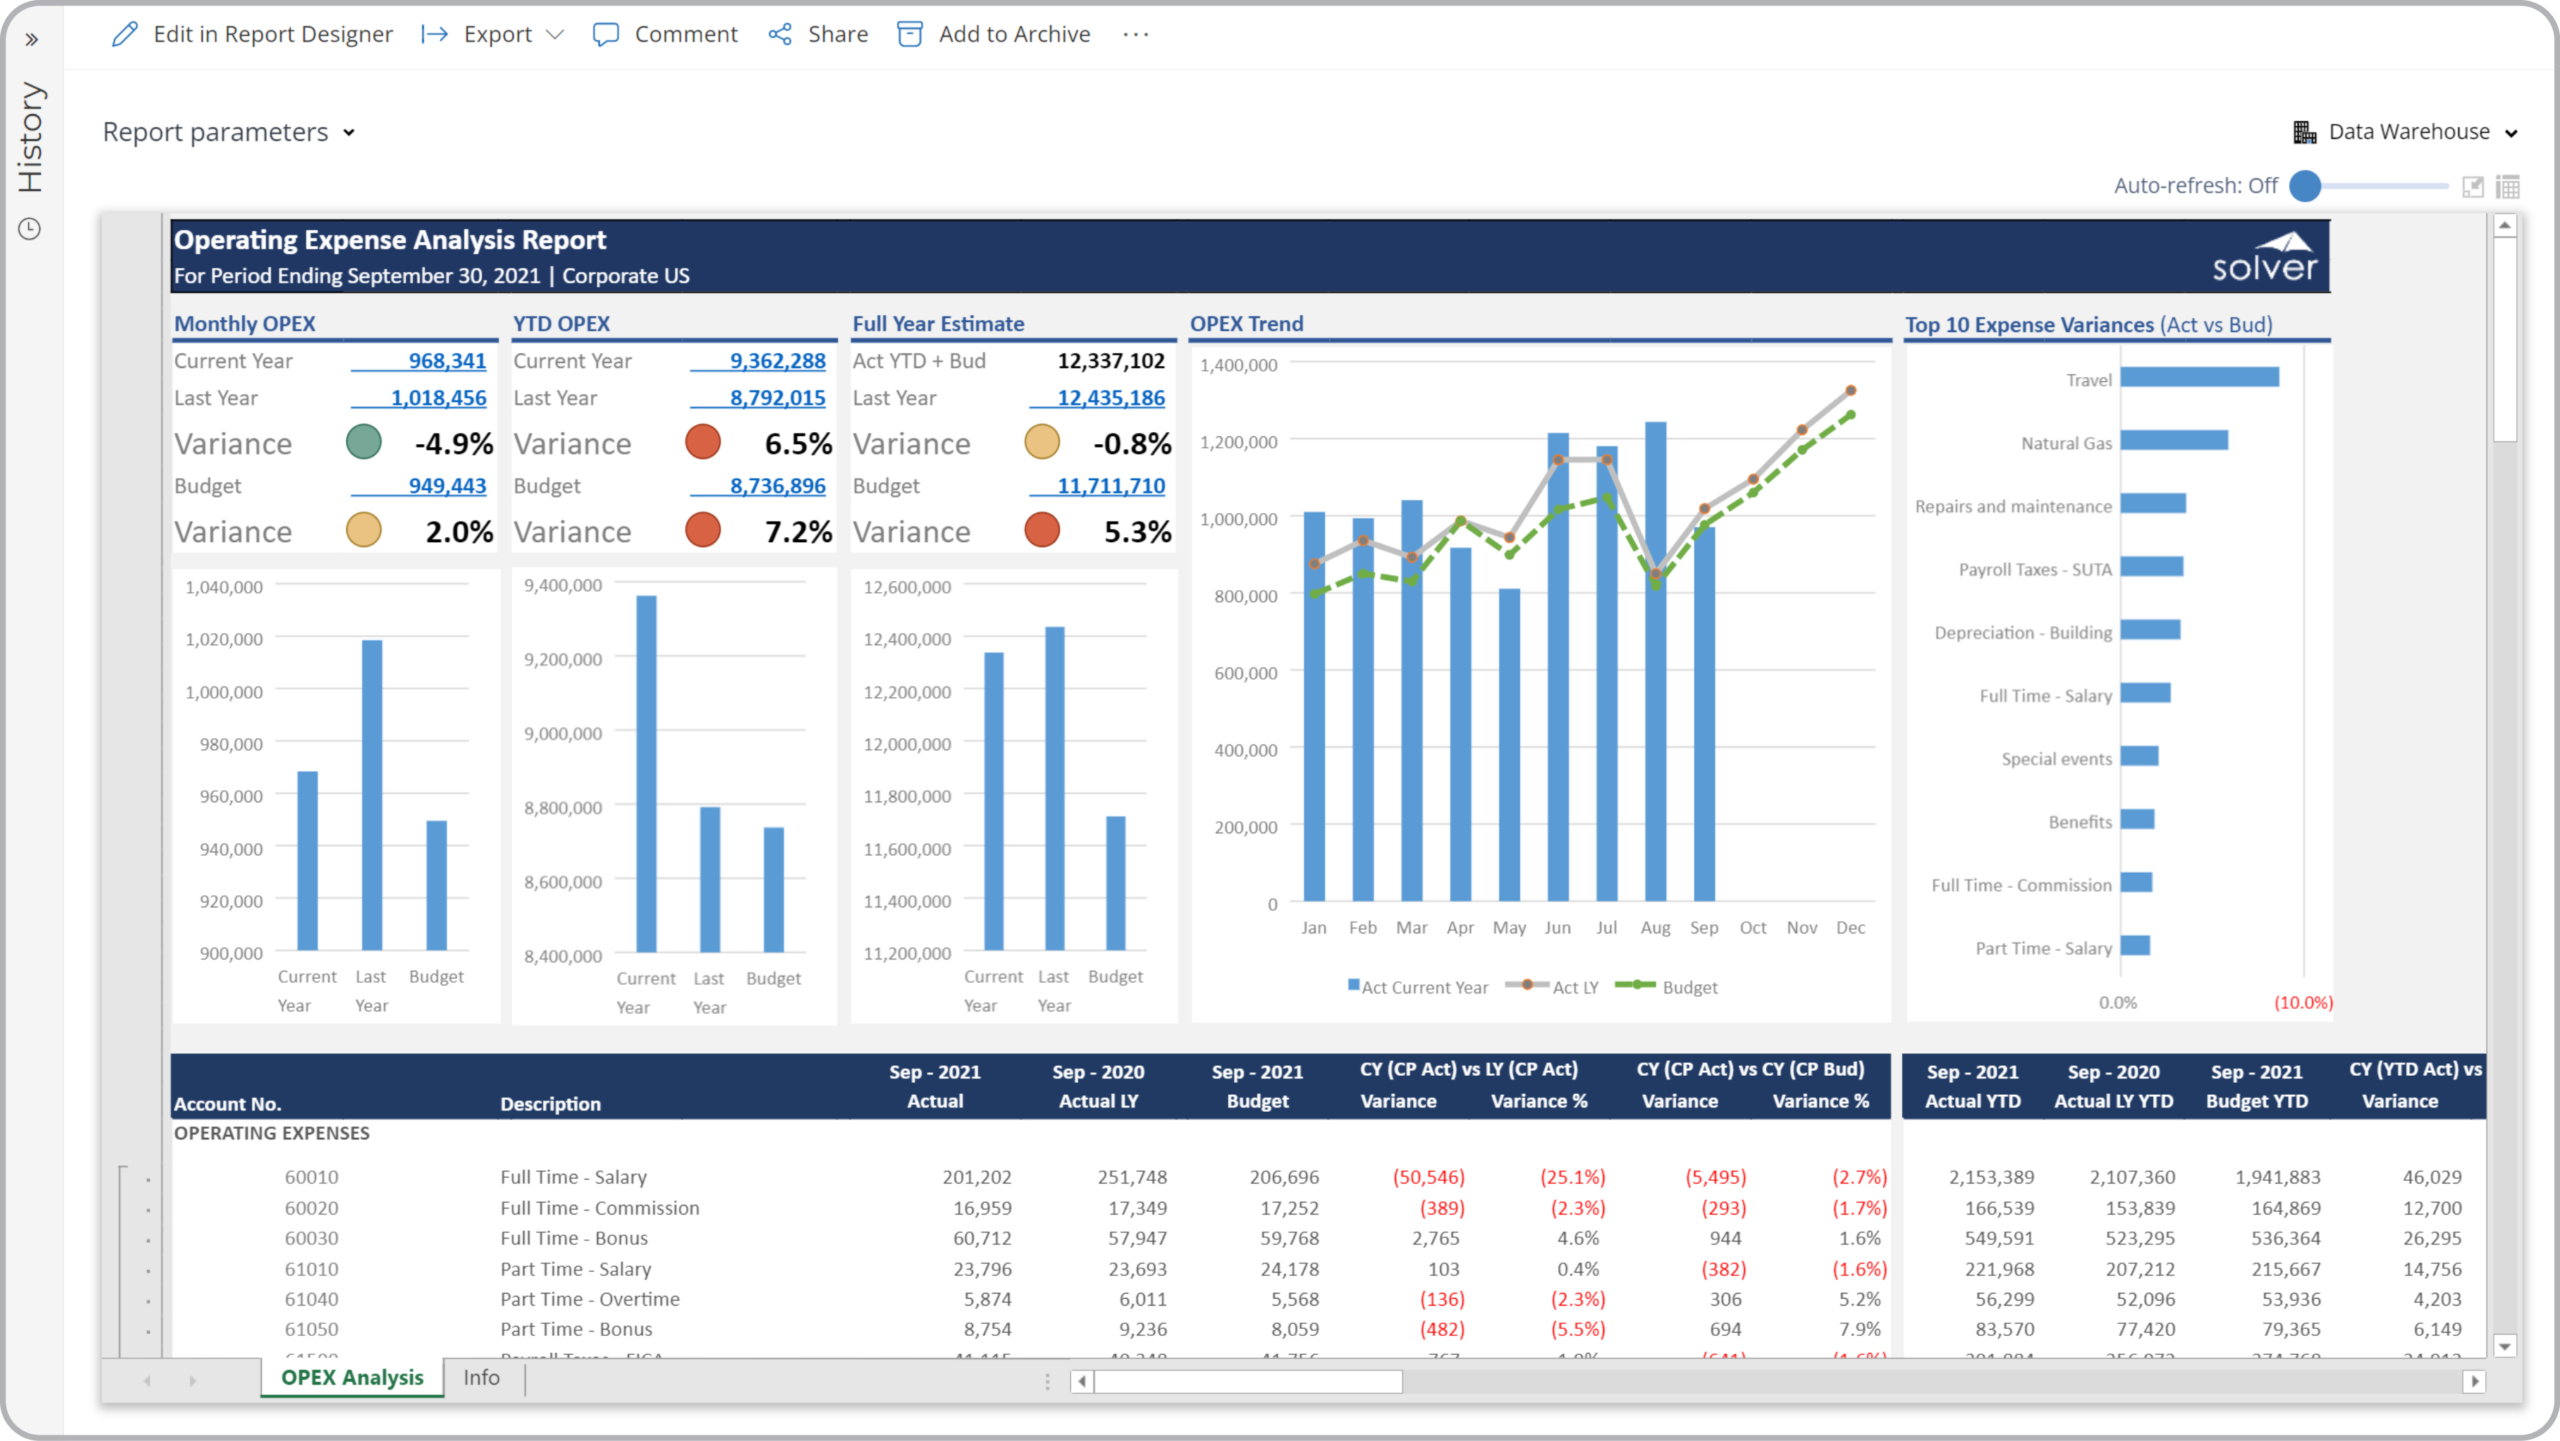
Profitability Analysis
It displays column charts to compare actual gross and net profit to budget and last year. The matrix on the top right shows all the key components that drive profitability both for the month and year-to-date.
$