

Solver Marketplace
Explore based on functionality (reports, planning, and dashboard templates), or use the search function to filter by integration, industry, or to find a template that fits your specific needs. Save templates to your favorites list and use the "Share Favorites" link to share the list with others.
Icon Legend:
💲 Requires consulting hours to set up and configure
⭐ Save as a favorite and share with others
FUNCTIONALITY
- Reports
- Planning
- Dashboard
Data Source
Marketplace Data Source: Filter by Data Source to find assets specific to your system
Showcase Data Source: Filter by Data Source to find assets specific to your system
Industries
Marketplace Industries: Filter by Industries to find assets specific to your system
Showcase Industries: Filter by Industries to find assets specific to your system
industries
Marketplace Industries: Filter by your industry to find assets created for your specific needs
Showcase Industries: Filter by your industry to find assets created for your specific needs
739 - 744 of 868 Results
Favorite Page Results
Favorites


Reports
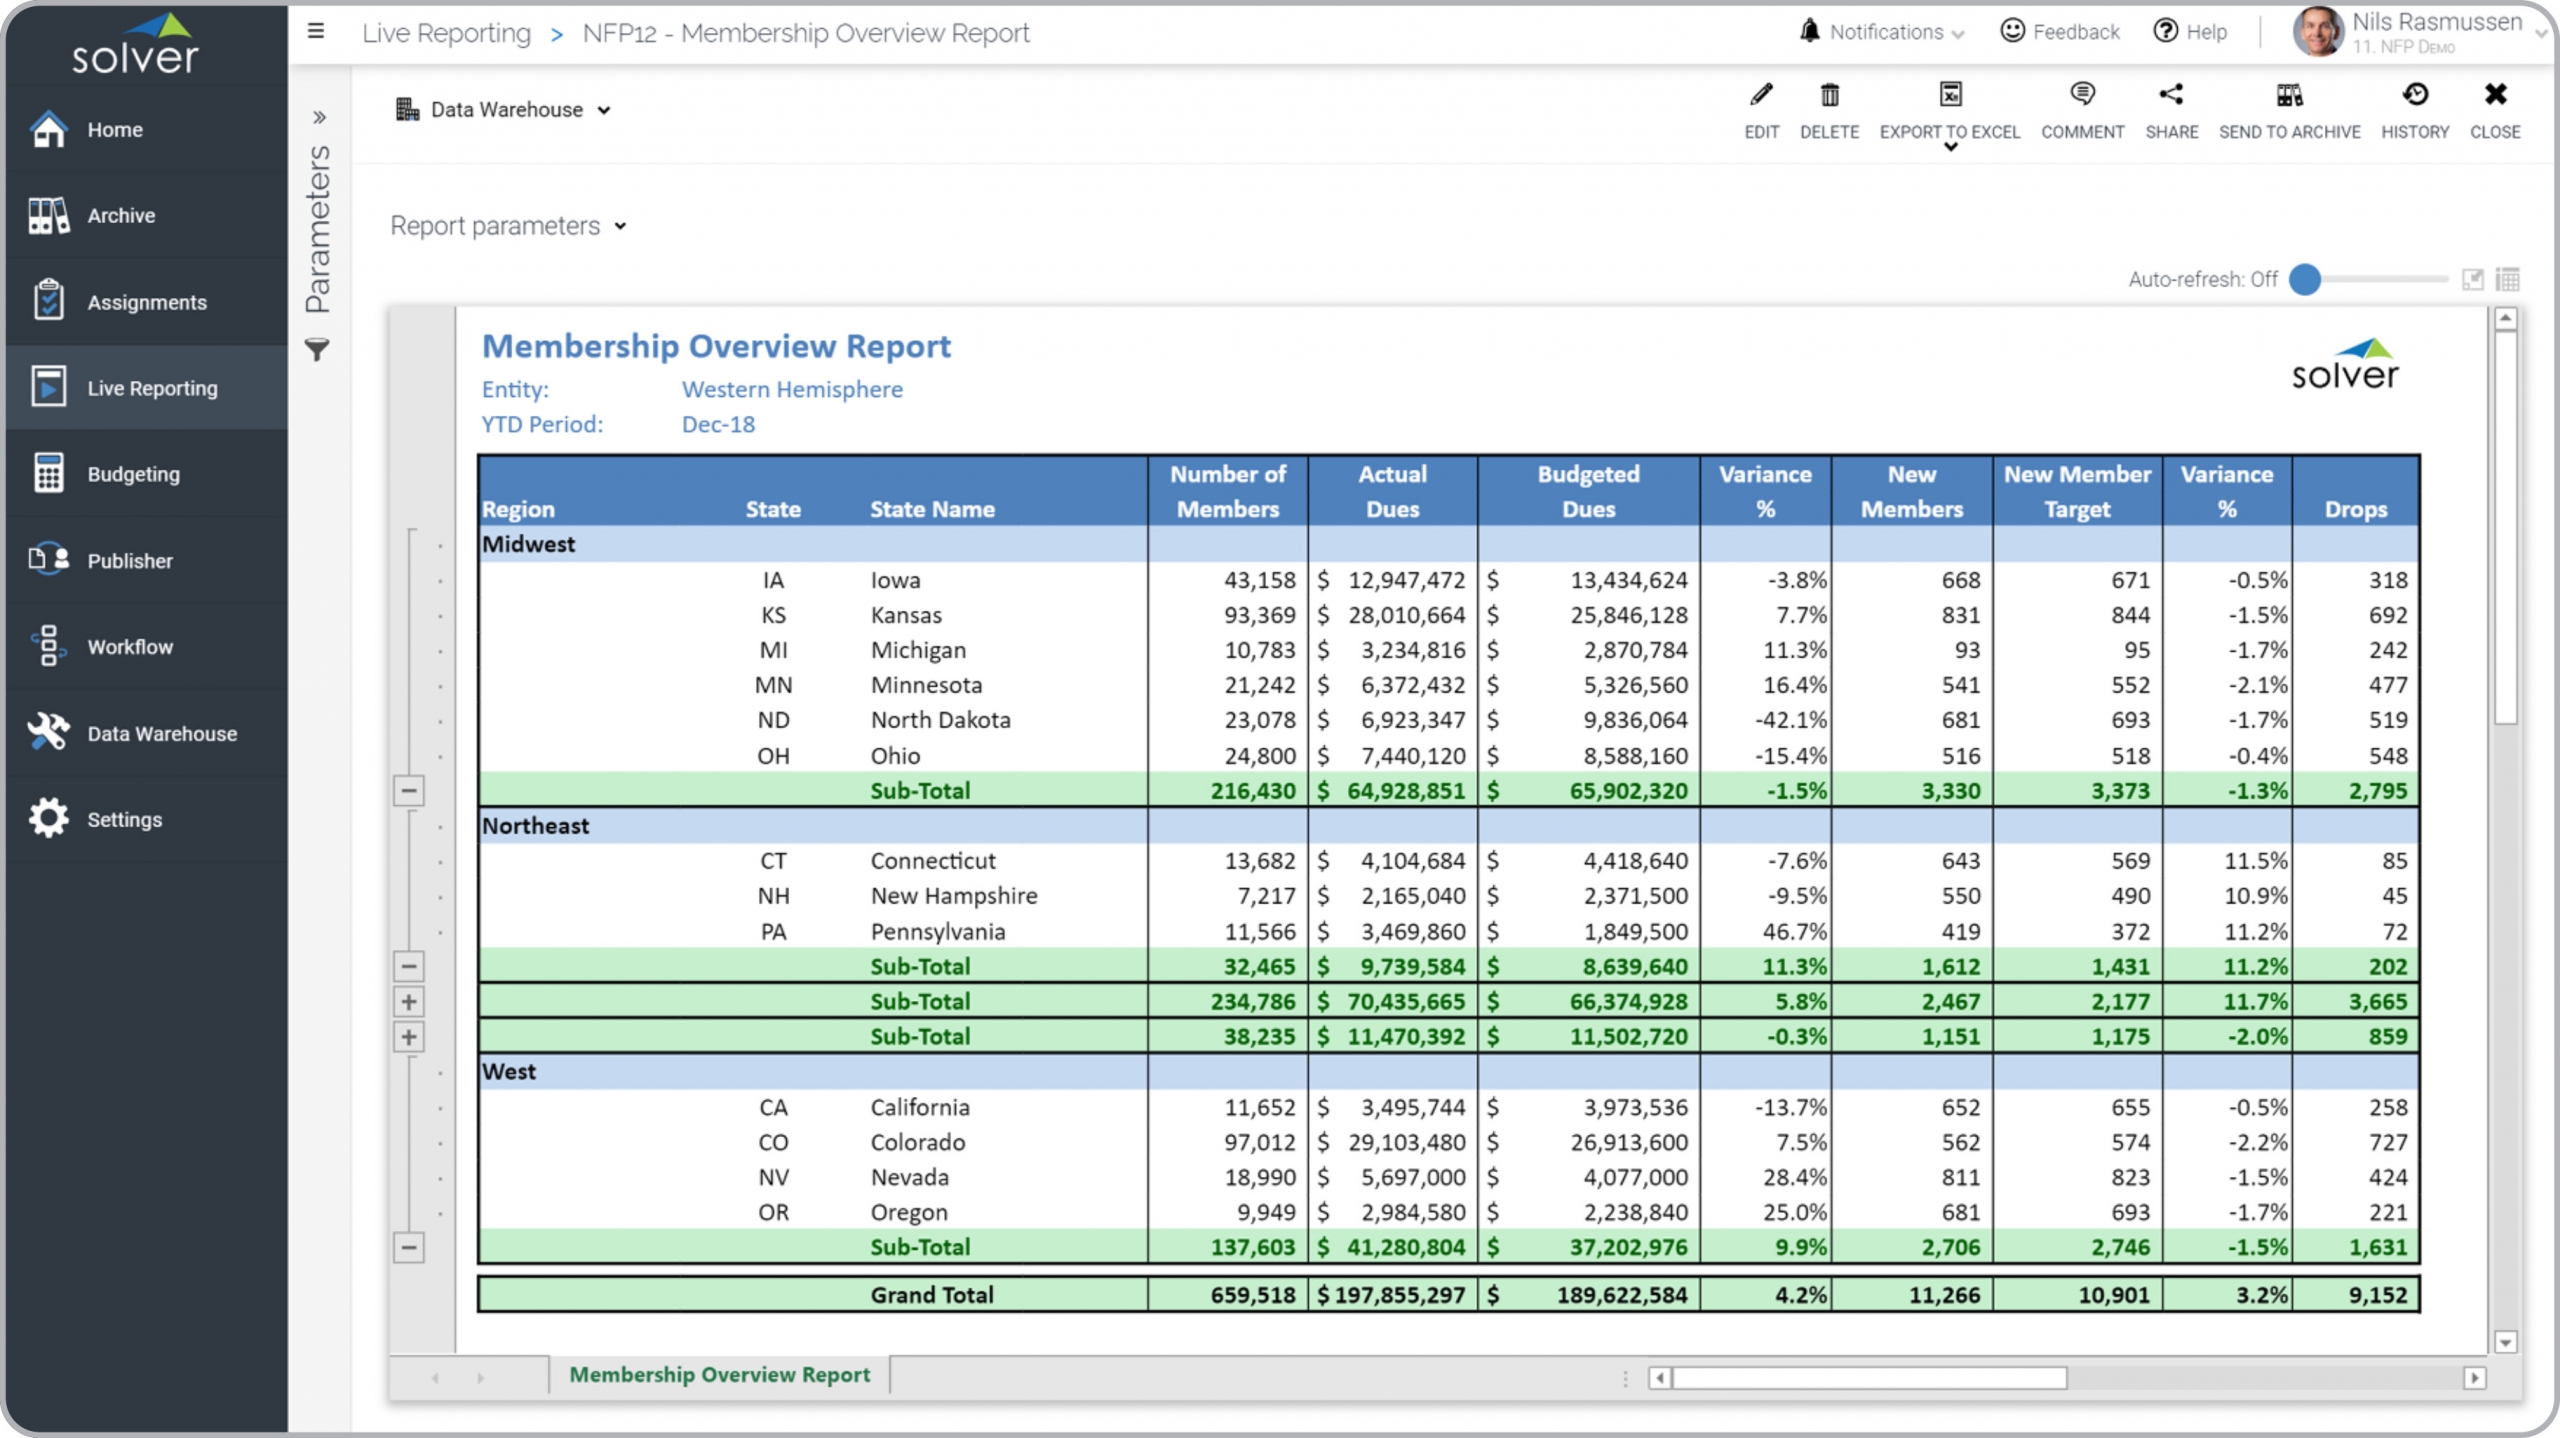
Nonprofit – Membership Overview
It can be run for any period and any organizational unit. The core of the report shows membership metrics by state and region with sub-totals and totals.
$
Planning
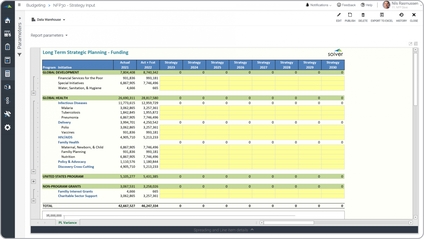
Nonprofit – Multi-year Program Funding
Enables nonprofit finance teams to plan and track multi-year program funding commitments by grant, donor, and program year. Supports long-range financial planning and funder reporting.
$
Reports
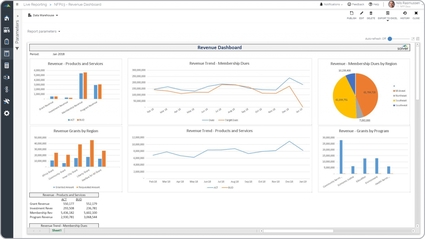
Nonprofit – Revenue Dashboard
Some of the key functionality visual report is that it it provides a mix of graphical analysis as well as a report (partially visible at the bottom of the screenshot below).
$
Reports
Nonprofit – Statement of Cash Flow
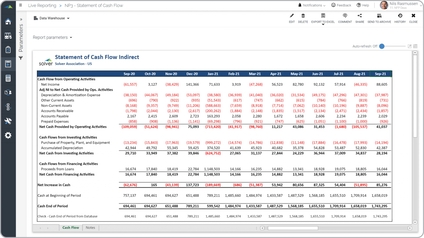
Some of the key functionality trend report is that it based on the month the user runs the report for, it will dynamically show the past 13 months. In other words, it is a rolling, trended statement of cash flows.
$
Dashboard
Nonprofit – Membership Dashboard Example
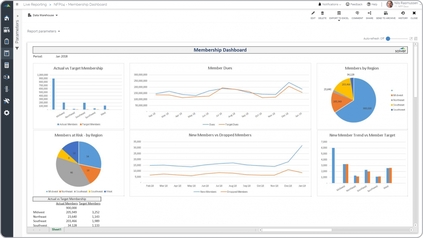
Some of the key functionality visual report is that it is parameter driven and can be run for any period. It has six KPI charts and a report section at the bottom.
$