

Solver Marketplace
Explore based on functionality (reports, planning, and dashboard templates), or use the search function to filter by integration, industry, or to find a template that fits your specific needs. Save templates to your favorites list and use the "Share Favorites" link to share the list with others.
Icon Legend:
💲 Requires consulting hours to set up and configure
⭐ Save as a favorite and share with others
FUNCTIONALITY
- Reports
- Planning
- Dashboard
Data Source
Marketplace Data Source: Filter by Data Source to find assets specific to your system
Showcase Data Source: Filter by Data Source to find assets specific to your system
Industries
Marketplace Industries: Filter by Industries to find assets specific to your system
Showcase Industries: Filter by Industries to find assets specific to your system
industries
Marketplace Industries: Filter by your industry to find assets created for your specific needs
Showcase Industries: Filter by your industry to find assets created for your specific needs
727 - 732 of 868 Results
Favorite Page Results
Favorites
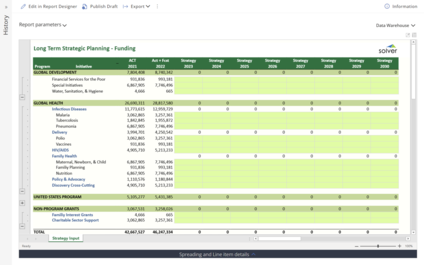


Planning
Nonprofit - Long Term Strategic Planning
Enables nonprofit executives and boards to build multi-year financial plans aligned with strategic goals in Solver. Supports long-range financial sustainability analysis.
$
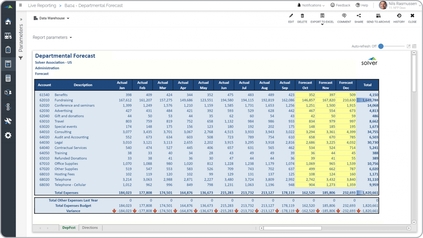
Planning
Nonprofit – Department Forecast
Key functionality input template retrieves year-to-date actual data for the chosen department and then provides input for the remaining periods of the year.
$
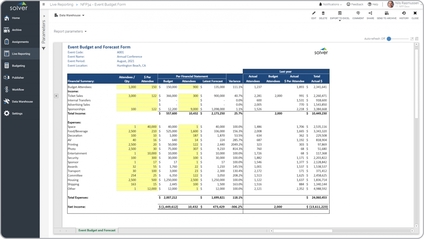
Planning
Nonprofit – Event Forecast
What are Event Budgeting and Forecasting Tools ? Key functionality input form allows the user to enter statistical metrics along with revenue and expense drivers for each event.
$
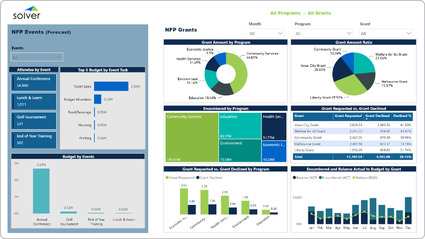
Dashboard
Nonprofit – Events and Grants Dashboard
It includes graphical analysis of nine different areas:. Top 5 event budget items,. Grant amount per program,.
$
Reports
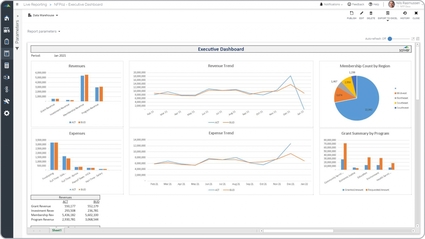
Nonprofit – Executive Dashboard
Some of the key functionality visual report is that it it provides a mix of graphical analysis as well as a report (partially visible at the bottom of the screenshot below).
$
Dashboard
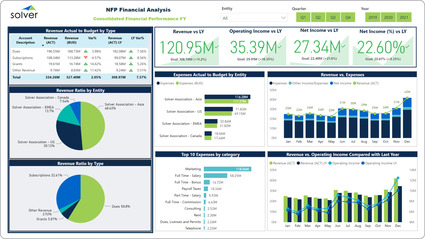
Nonprofit – Financial Dashboard
It provides analysis through eight different perspectives on the dashboard. Actual versus budget and Last Year variance analysis for revenues,.
$