

Solver Marketplace
Explore based on functionality (reports, planning, and dashboard templates), or use the search function to filter by integration, industry, or to find a template that fits your specific needs. Save templates to your favorites list and use the "Share Favorites" link to share the list with others.
Icon Legend:
💲 Requires consulting hours to set up and configure
⭐ Save as a favorite and share with others
FUNCTIONALITY
- Reports
- Planning
- Dashboard
Data Source
Marketplace Data Source: Filter by Data Source to find assets specific to your system
Showcase Data Source: Filter by Data Source to find assets specific to your system
Industries
Marketplace Industries: Filter by Industries to find assets specific to your system
Showcase Industries: Filter by Industries to find assets specific to your system
industries
Marketplace Industries: Filter by your industry to find assets created for your specific needs
Showcase Industries: Filter by your industry to find assets created for your specific needs
55 - 60 of 871 Results
Favorite Page Results
Favorites
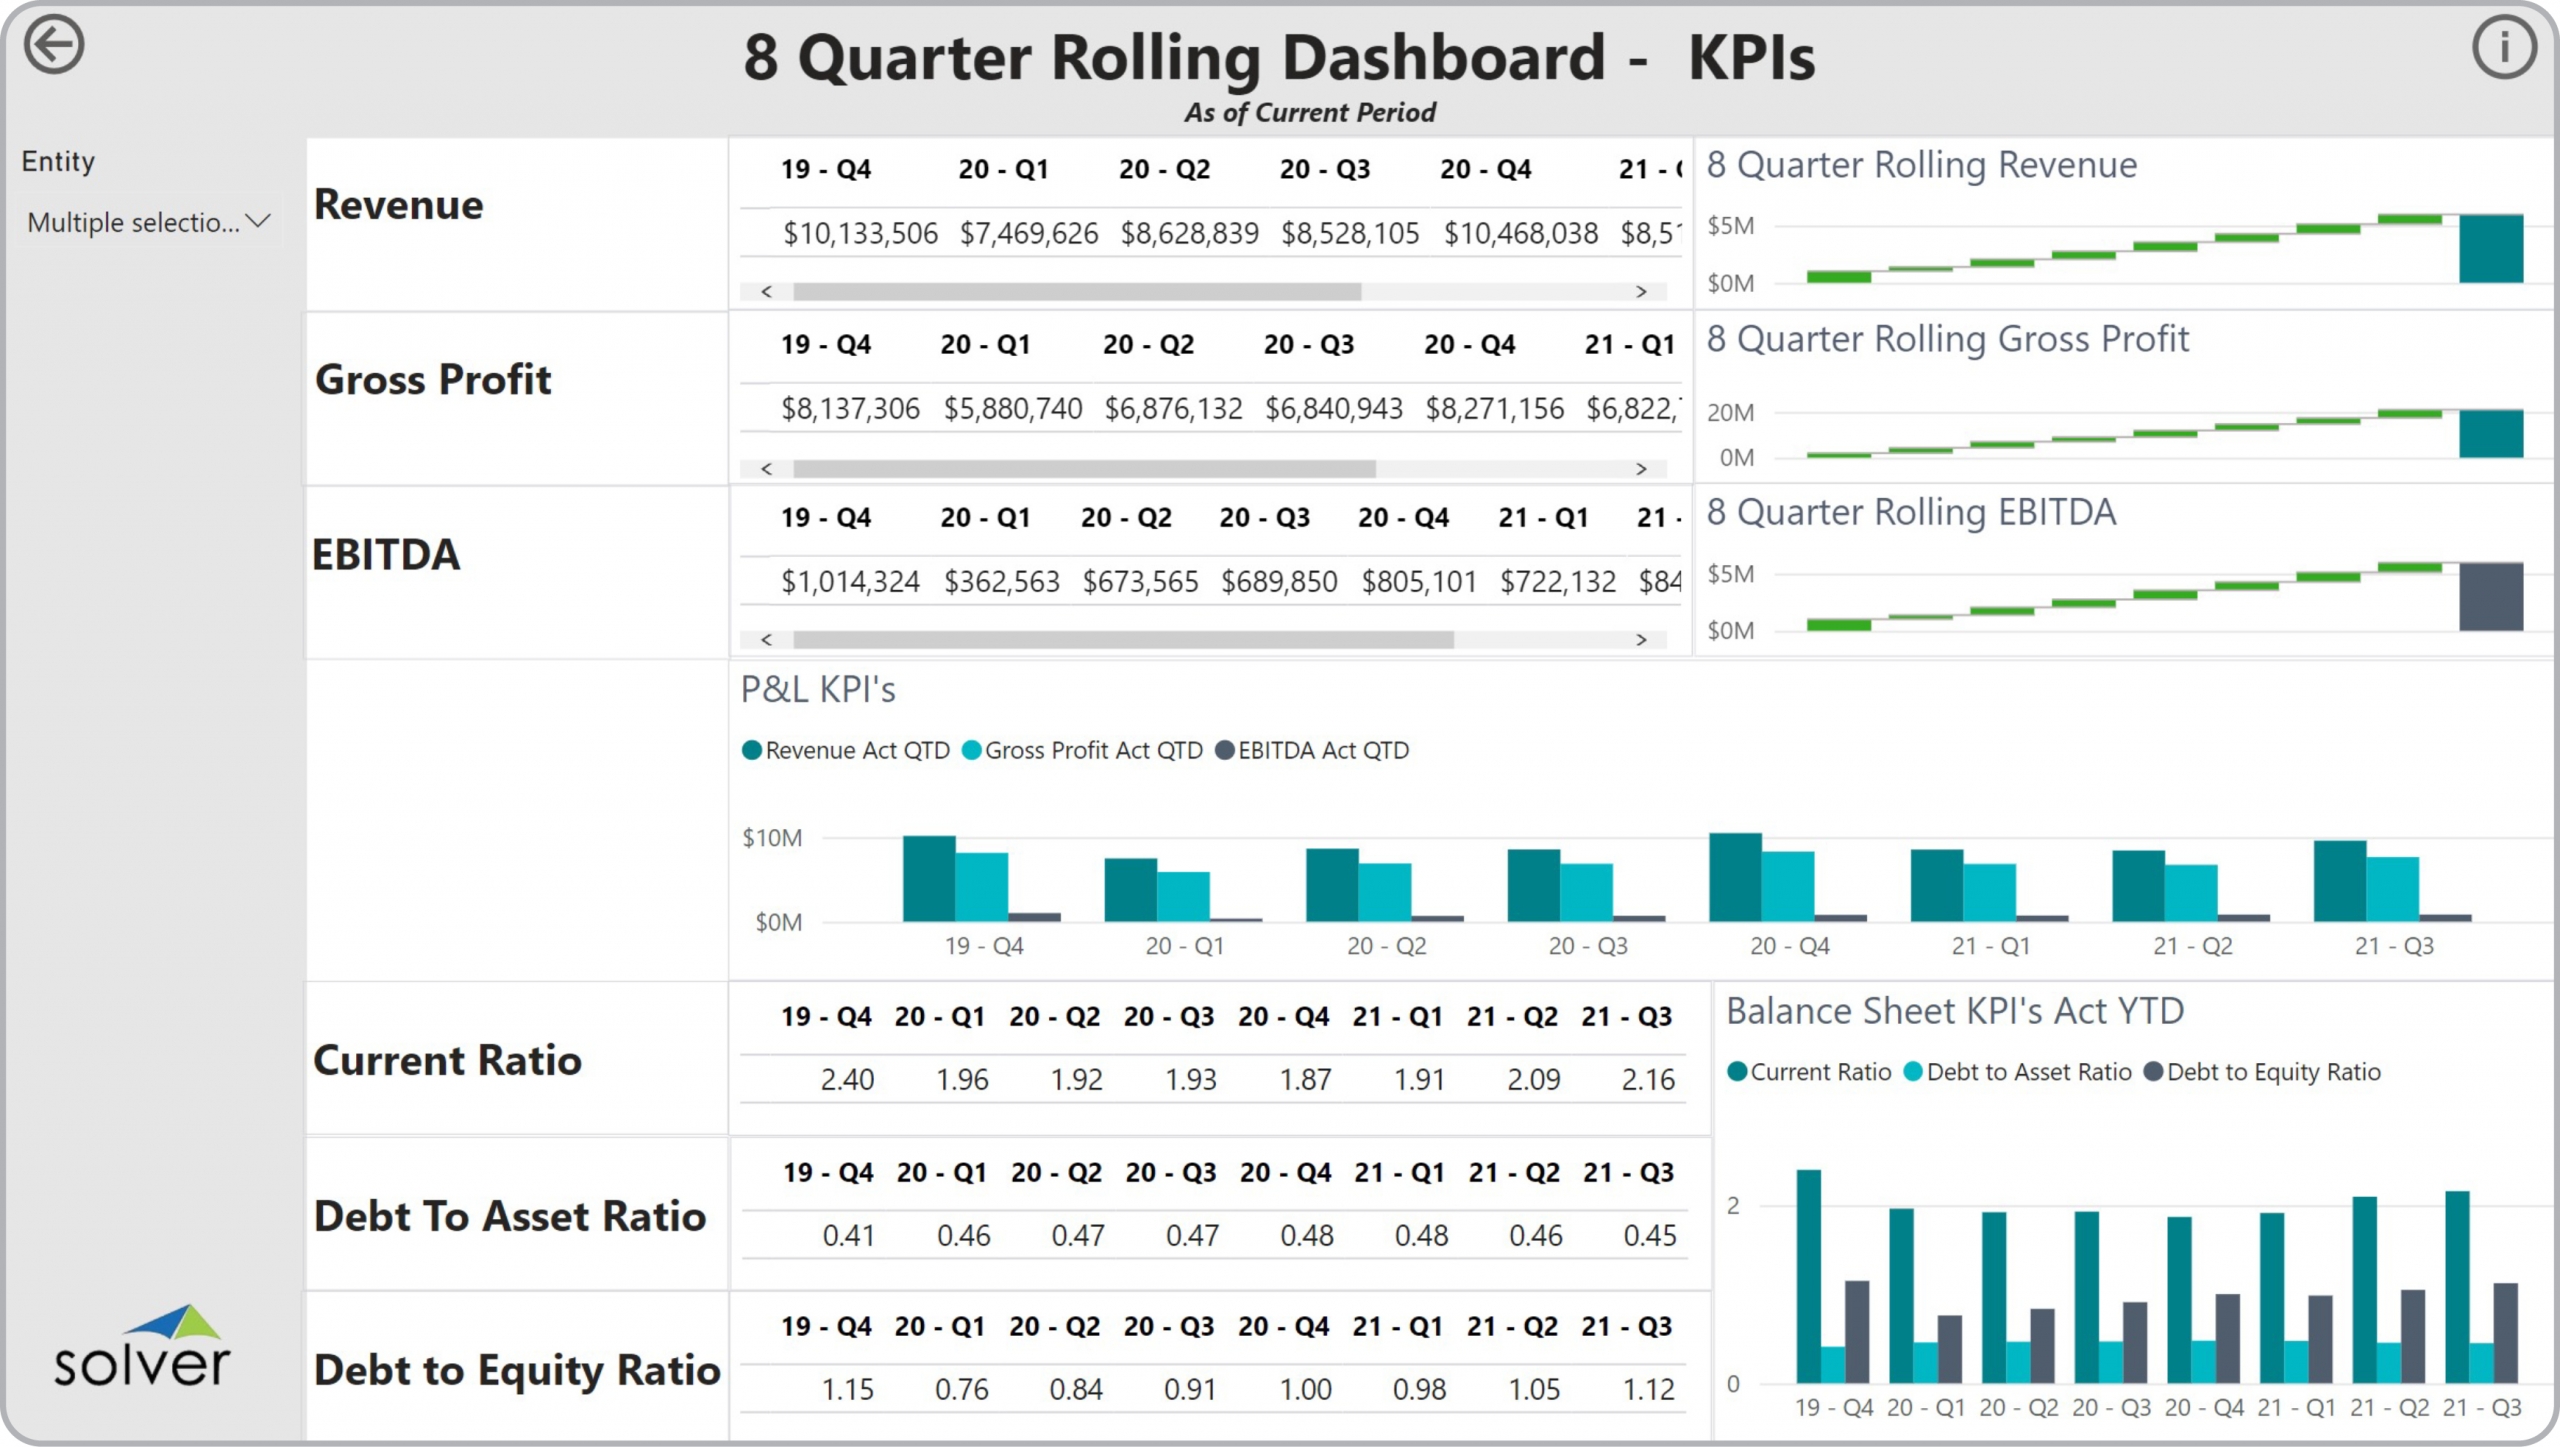


Dashboard
GL Dashboard – 8 Quarter KPI Trend
It gives CFOs, FP&A managers, and business unit leaders fast, reliable access to the financial and operational insights they need — without custom development.
$
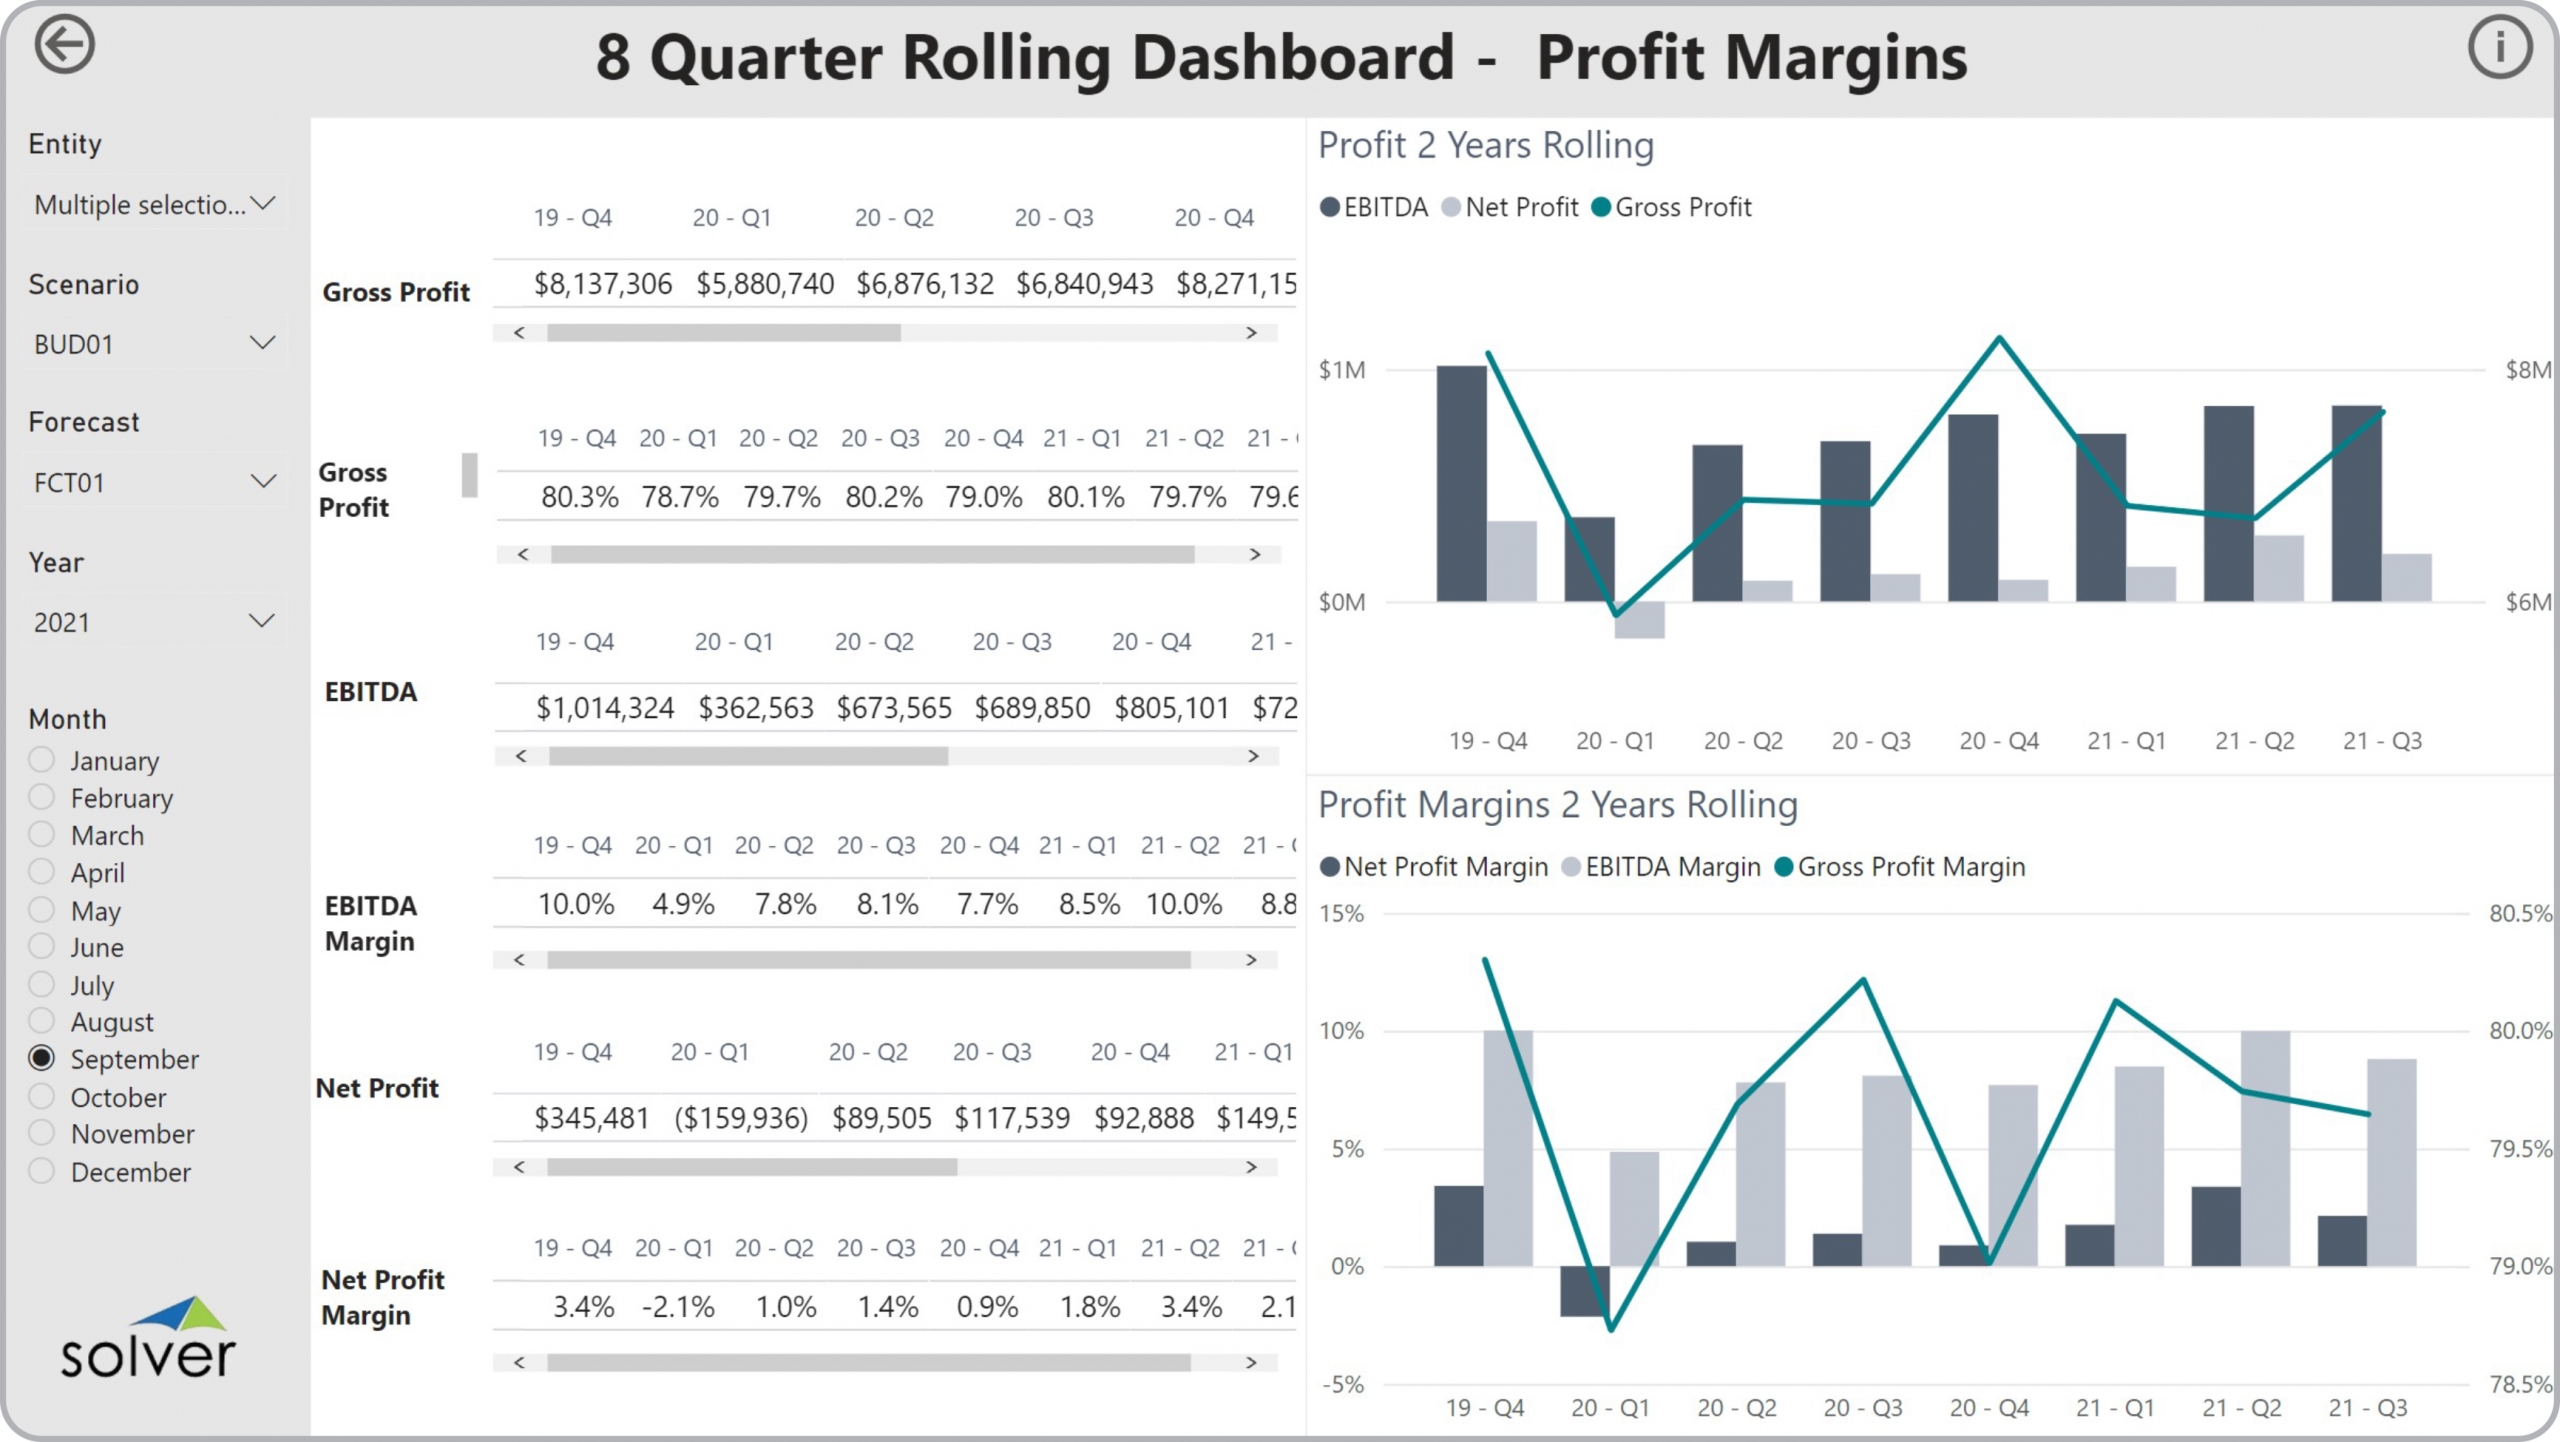
Dashboard
GL Dashboard – 8 Quarter Profitability Trend
It gives CFOs, FP&A managers, and business unit leaders fast, reliable access to the financial and operational insights they need — without custom development.
$
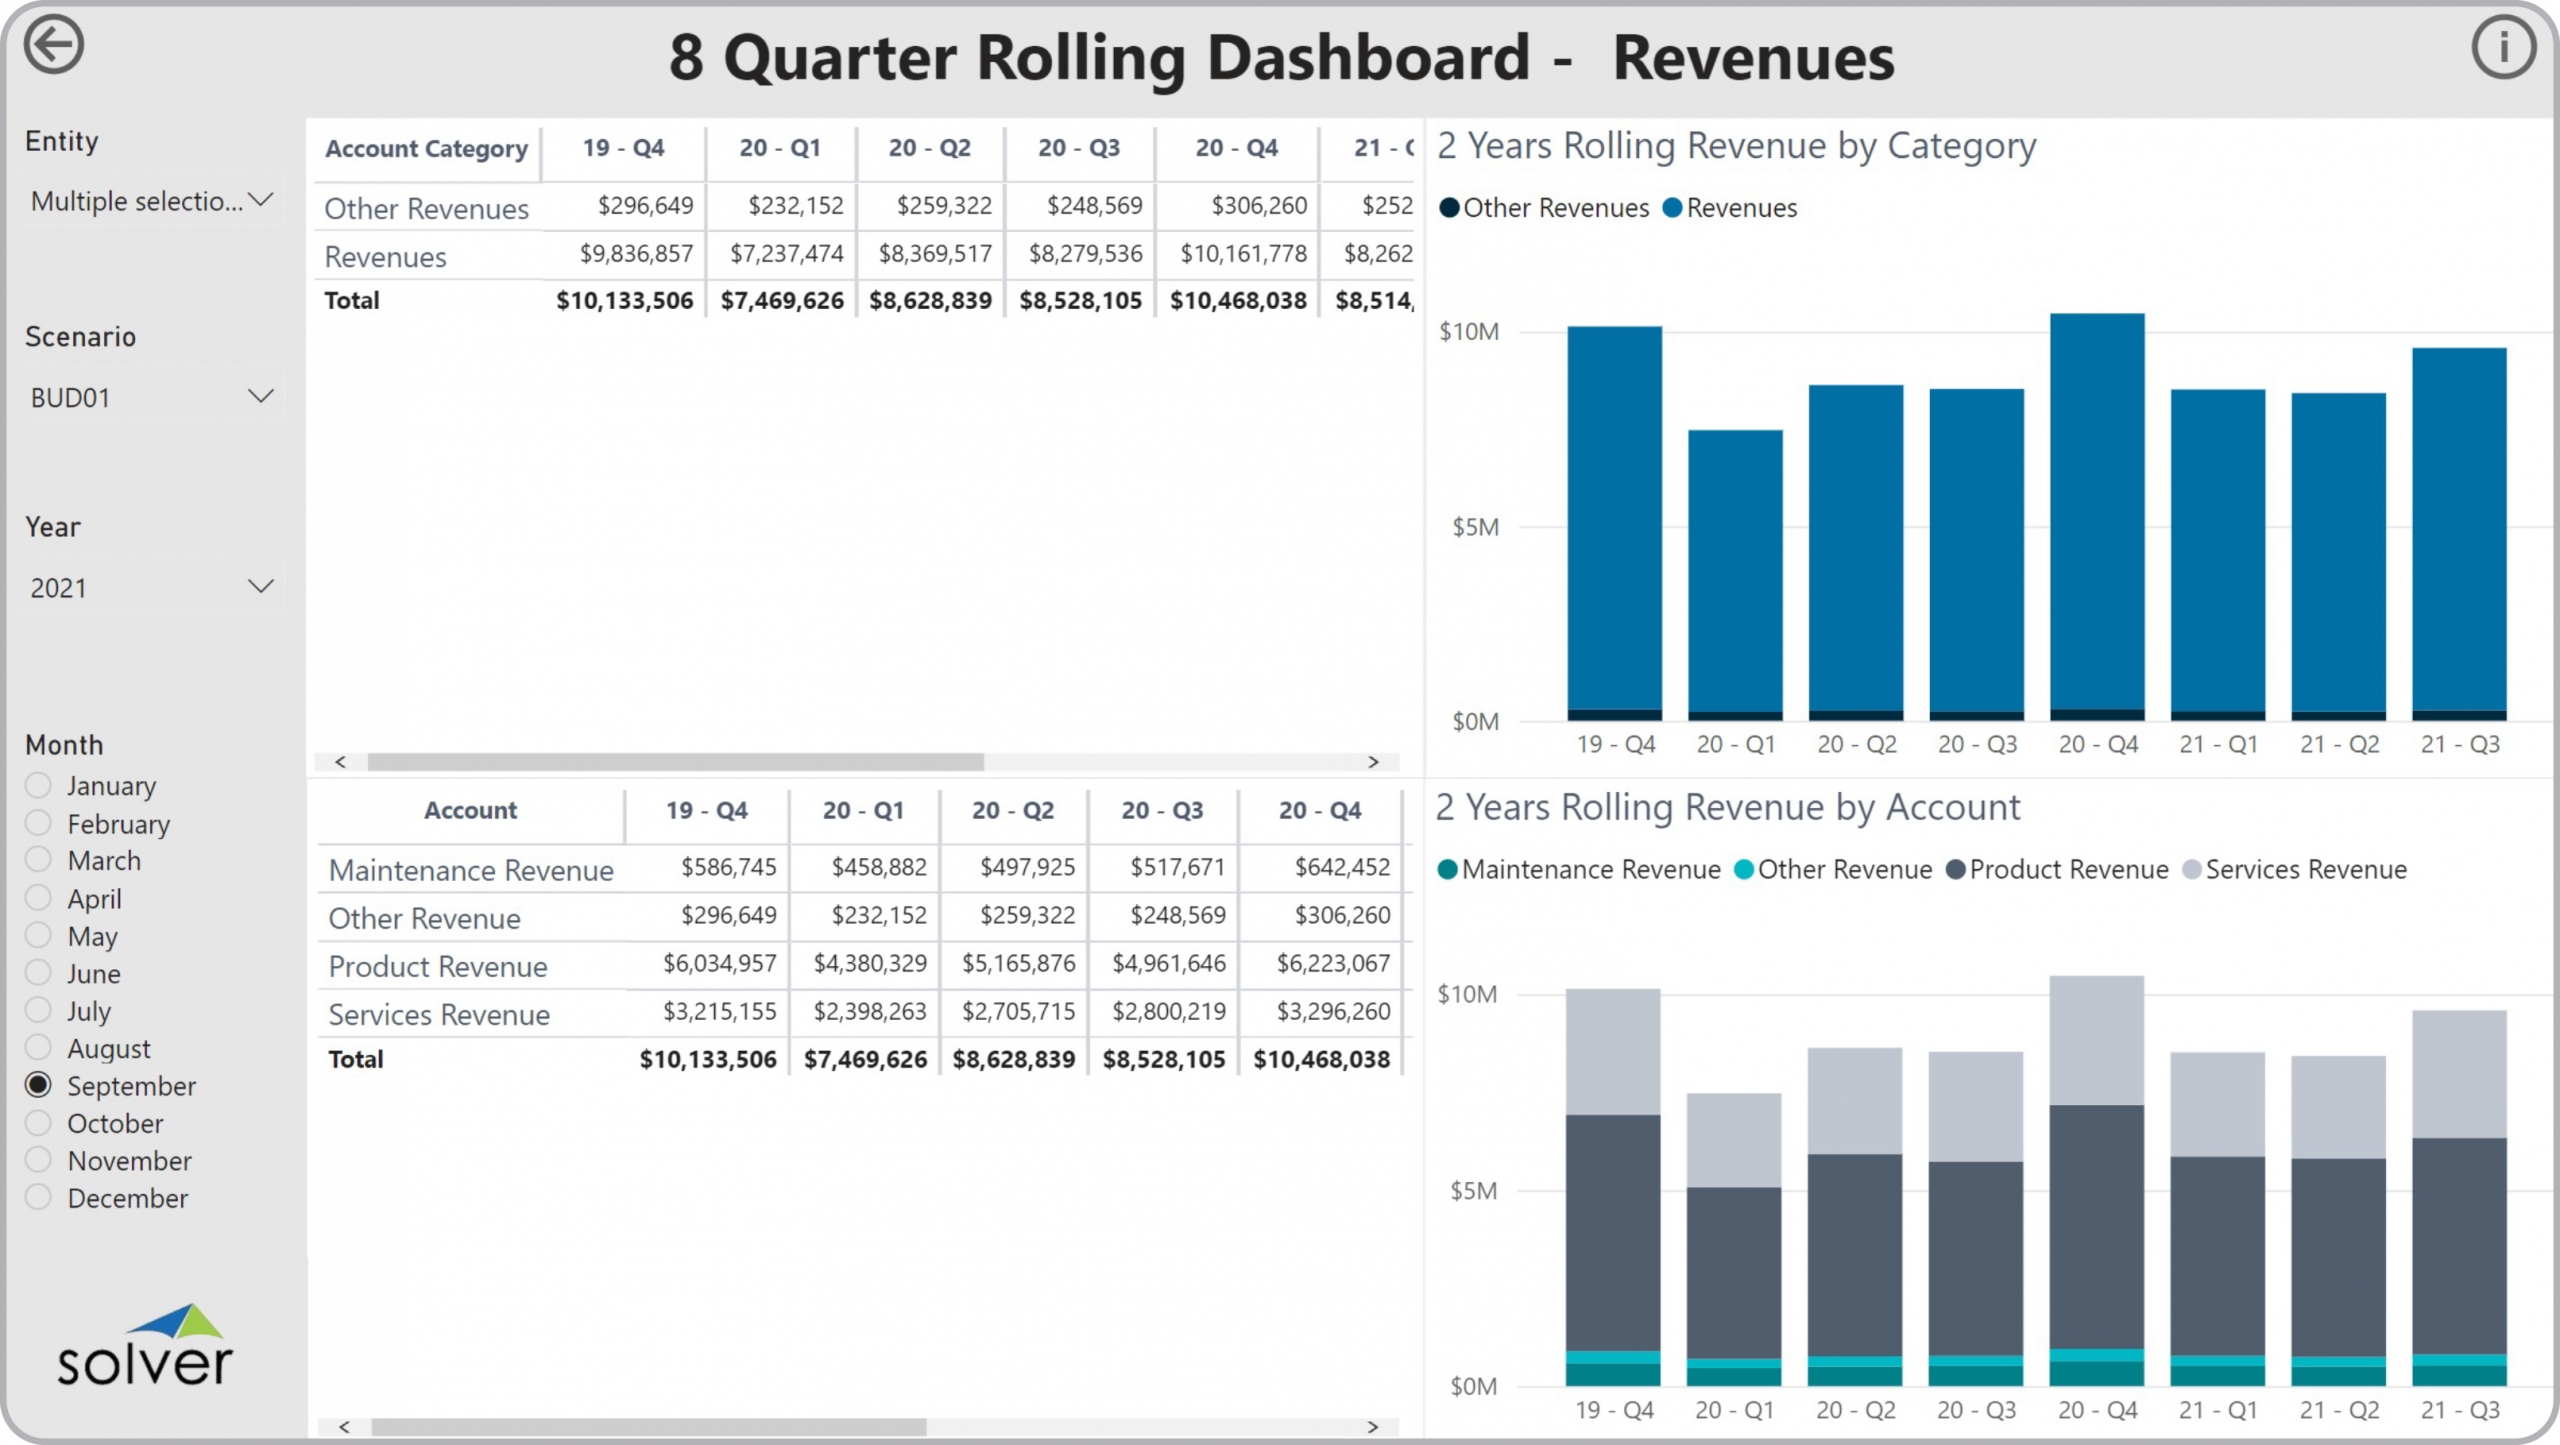
Dashboard
GL Dashboard – 8 Quarter Revenue Trend
It gives CFOs, FP&A managers, and business unit leaders fast, reliable access to the financial and operational insights they need — without custom development.
$
Dashboard
GL Dashboard – Business Comparison – Balance Sheet
It gives CFOs, FP&A managers, and business unit leaders fast, reliable access to the financial and operational insights they need — without custom development.
$
Dashboard
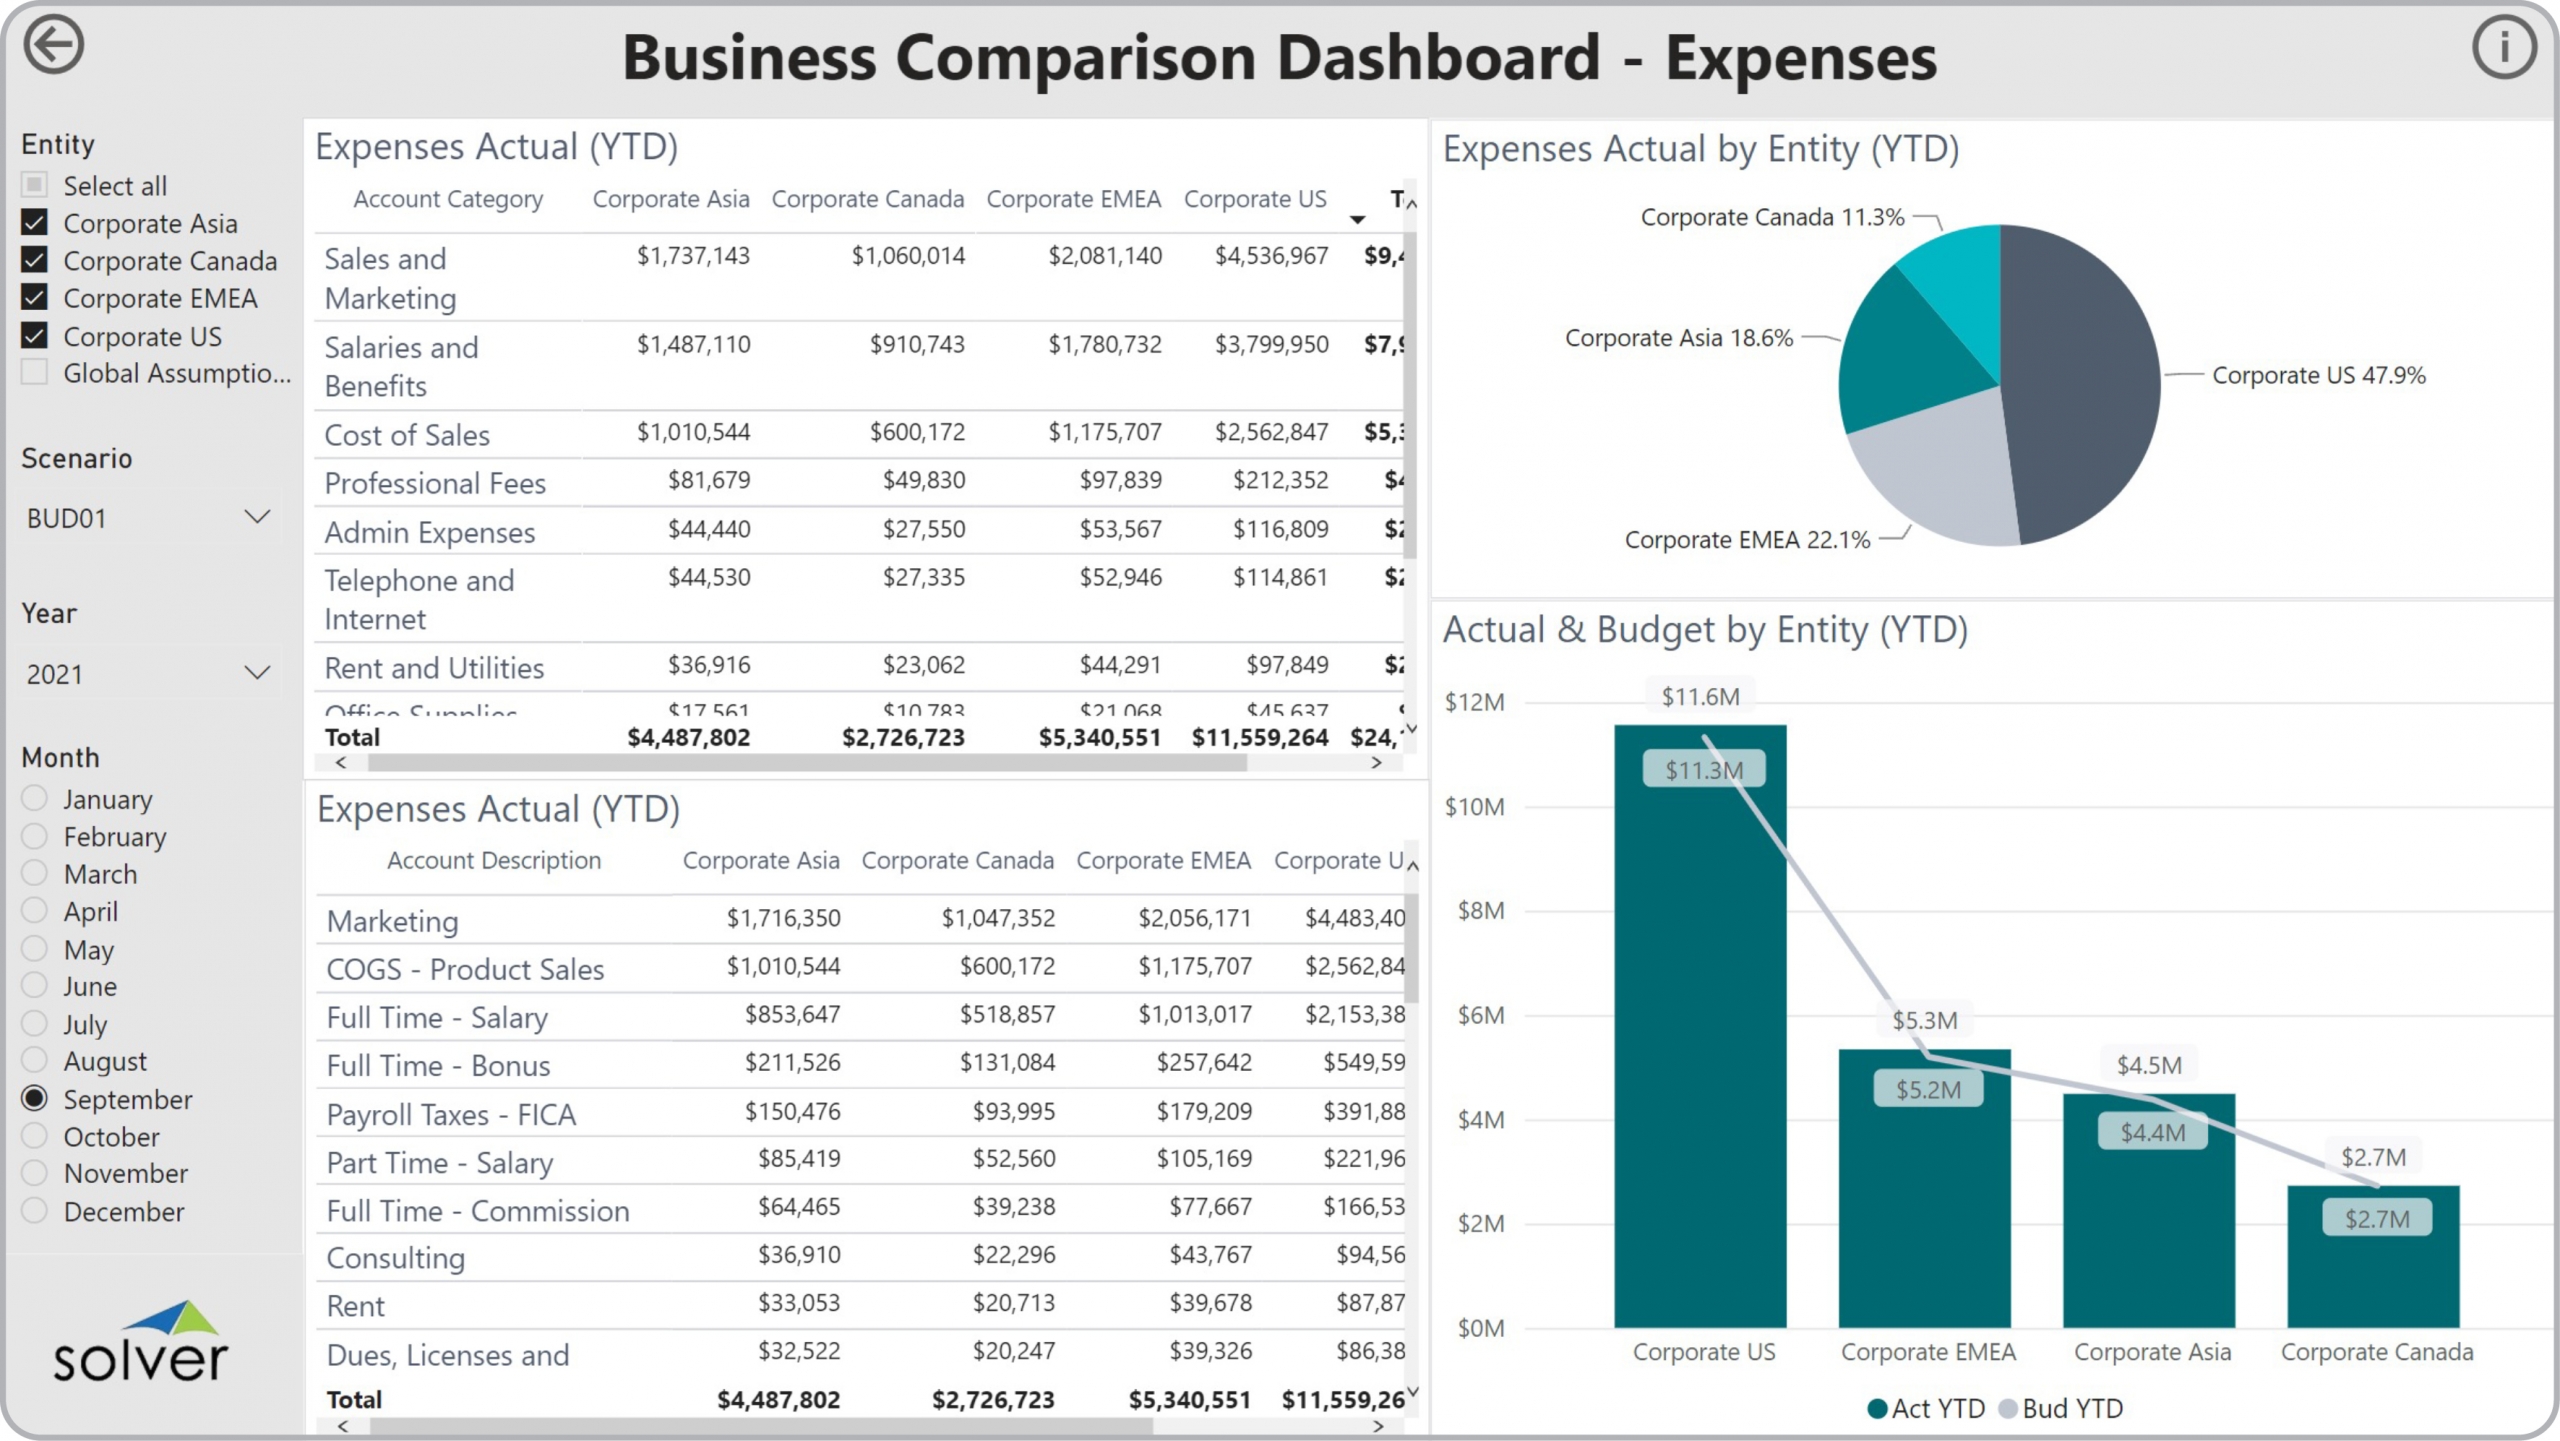
GL Dashboard – Business Comparison – Expenses
Expense Comparison Dashboards to Streamline the Monthly Reporting and Consolidations Process
$
Dashboard
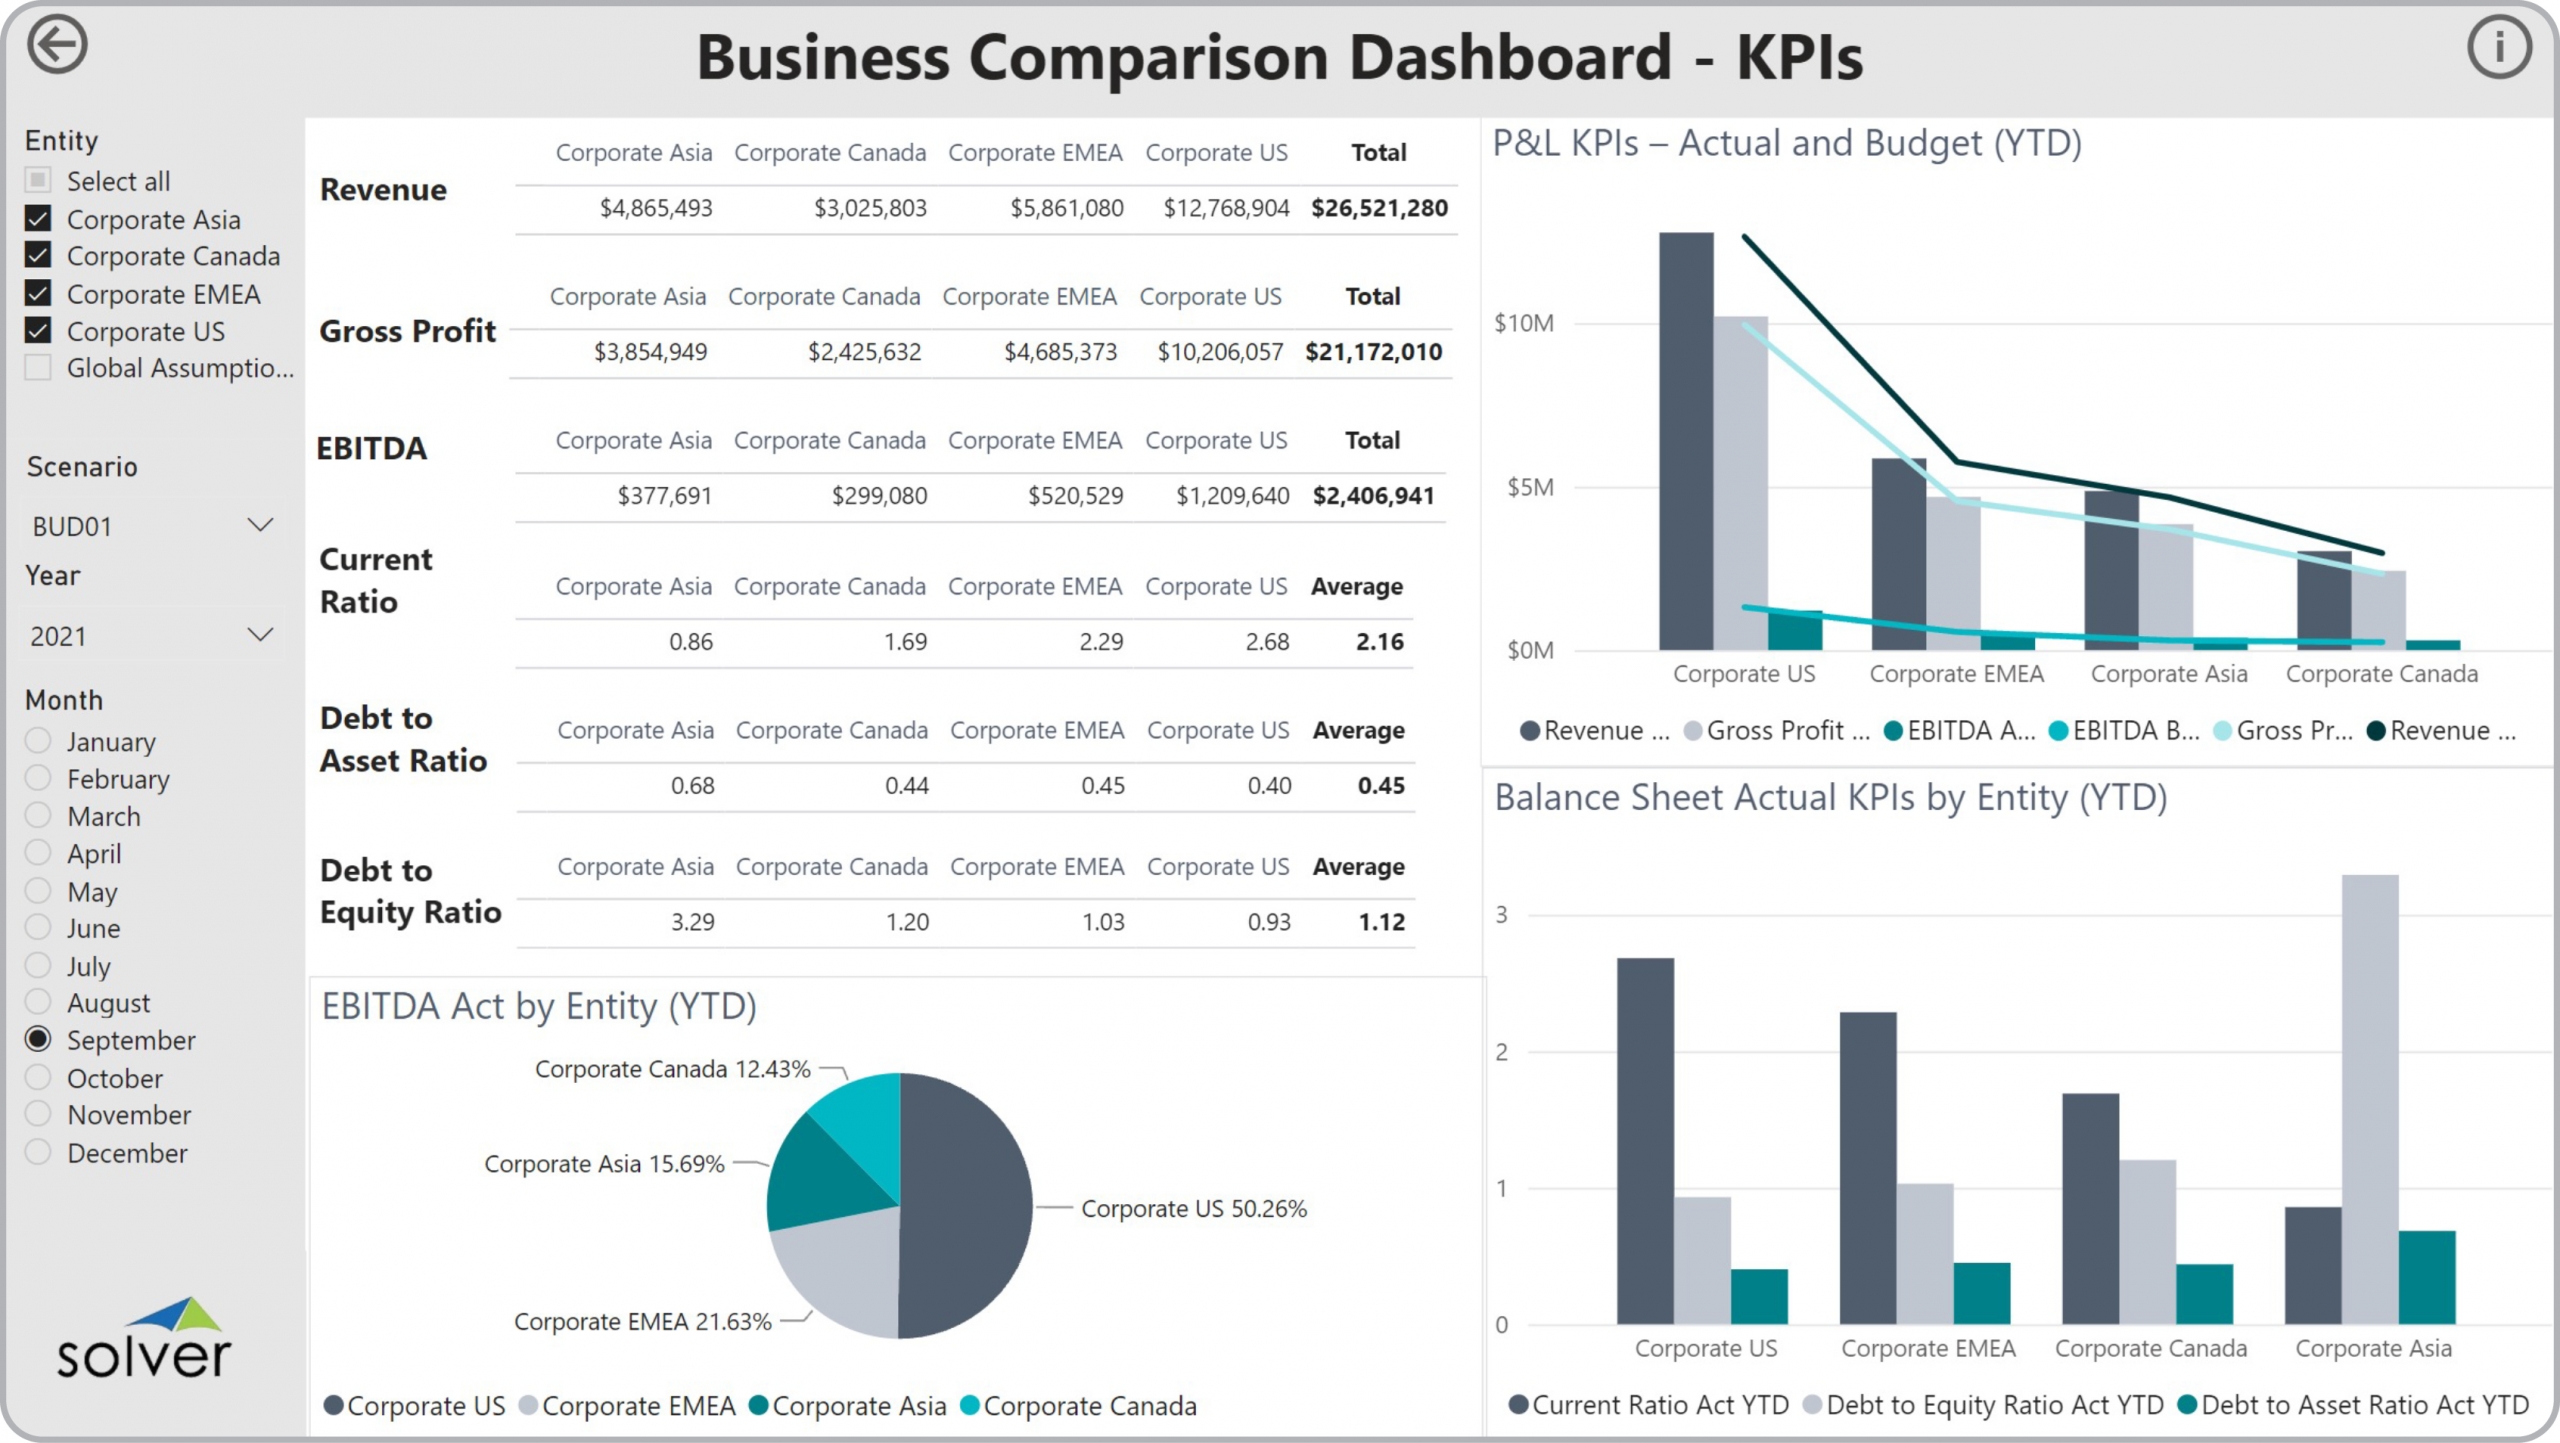
GL Dashboard – Business Comparison – KPIs
It gives CFOs, FP&A managers, and business unit leaders fast, reliable access to the financial and operational insights they need — without custom development.
$