

Solver-markedsplads
Udforsk efter funktionalitet (rapporter, planlægning og dashboard-skabeloner), eller brug søgefunktionen til at filtrere efter integration, branche eller for at finde en skabelon, der passer til dine specifikke behov. Gem skabeloner på din favoritliste, og brug linket »Del favoritter« til at dele listen med andre.
Ikonforklaring:
💲 Kræver konsulenttimer til opsætning og konfiguration
⭐ Gem som favorit og del med andre
FUNCTIONALITY
- Reports
- Planning
- Dashboard
Data Source
Marketplace Data Source: Filter by Data Source to find assets specific to your system
Showcase Data Source: Filter by Data Source to find assets specific to your system
Industries
Marketplace Industries: Filter by Industries to find assets specific to your system
Showcase Industries: Filter by Industries to find assets specific to your system
industries
Marketplace Industries: Filter by your industry to find assets created for your specific needs
Showcase Industries: Filter by your industry to find assets created for your specific needs
253 - 258 of 868 Results
Favorite Page Results
Favorites


Reports
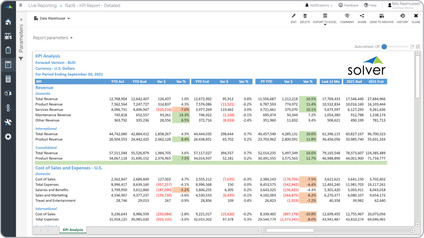
Detailed KPI Variance Report
It displays both financial and statistical metrics (many are not visible in the example below). The columns show a variety of data including actual year-to-date, 12 month's rolling, budget, forecast and variances.
$
Reports
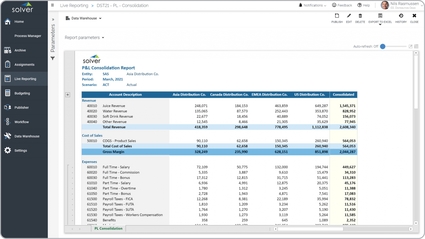
Distribution – Consolidation Report
It dynamically lists subsidiaries across the columns with an aggregate total in the far right column.
$
Dashboard
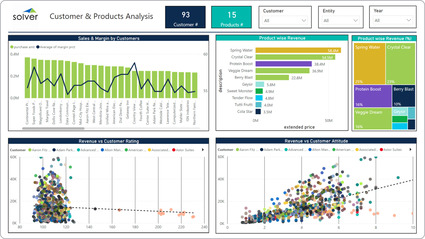
Distribution - Customer and Product Analysis
Analyzes distribution performance across both customer and product dimensions simultaneously, showing sales volumes, margins, and trends. Helps distribution managers optimize pricing and customer mix.
$
Dashboard
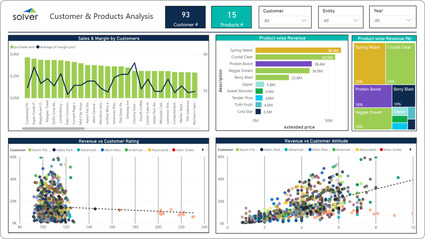
Distribution – Customer and Product Analysis
It offers interactive graphical KPI analysis, including views of:. New customer and product count,. Sales and margin ranked by customer,.
$
Reports
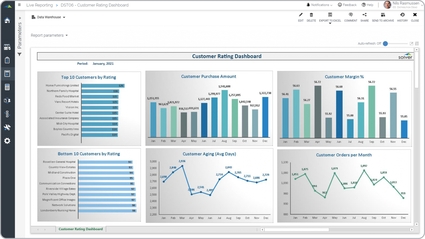
Distribution – Customer Rating Dashboard
It gives a unique set of customer metrics that few companies currently have. The six charts provides analysis of.
$
Reports
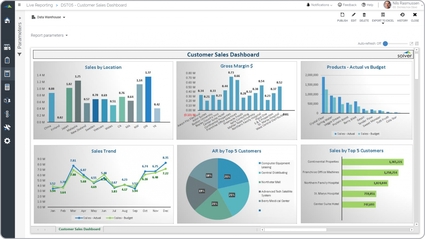
Distribution – Customer Sales Dashboard
It provides six visualizations for KPI analysis:. Sales by sales manager,. Gross margin by product,.
$