

Solver-markedsplads
Udforsk efter funktionalitet (rapporter, planlægning og dashboard-skabeloner), eller brug søgefunktionen til at filtrere efter integration, branche eller for at finde en skabelon, der passer til dine specifikke behov. Gem skabeloner på din favoritliste, og brug linket »Del favoritter« til at dele listen med andre.
Ikonforklaring:
💲 Kræver konsulenttimer til opsætning og konfiguration
⭐ Gem som favorit og del med andre
FUNCTIONALITY
- Reports
- Planning
- Dashboard
Data Source
Marketplace Data Source: Filter by Data Source to find assets specific to your system
Showcase Data Source: Filter by Data Source to find assets specific to your system
Industries
Marketplace Industries: Filter by Industries to find assets specific to your system
Showcase Industries: Filter by Industries to find assets specific to your system
industries
Marketplace Industries: Filter by your industry to find assets created for your specific needs
Showcase Industries: Filter by your industry to find assets created for your specific needs
241 - 246 of 868 Results
Favorite Page Results
Favorites


Reports
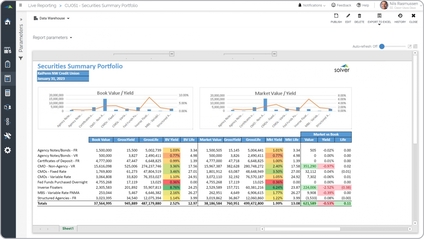
Credit Union – Securities Summary Portfolio
It combines charts, figures and exception highlighting to optimize analysis.
$
Reports
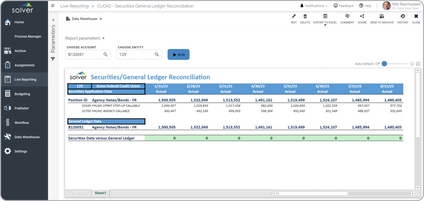
Credit Union – Securities/GL Reconciliation
It for any given GL account chosen by the user will list and match with the related securities transactions.
$
Reports
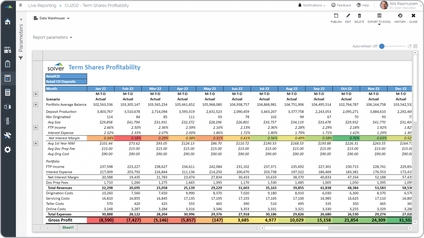
Credit Union – Term Shares Profitability
It dynamically lists the months of the year across the columns and loan metrics down the rows with a Gross Profit total at the bottom.
$
Reports
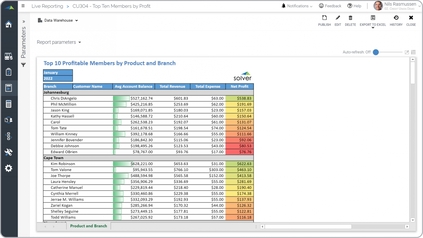
Credit Union – Top 10 Members by Profit
It groups the top 10 members by branch location and then ranks them based on profitability.
$
Reports
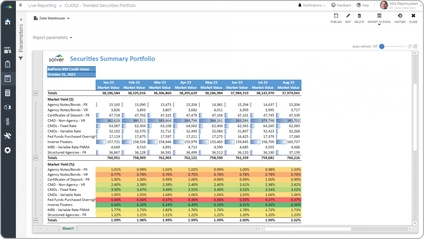
Credit Union – Trended Securities Portfolio
Some of the main functionality monthly trend report is that it dynamically lists months up to the current period across the columns with market values and yields in percent and amount figures down the rows.
$
Reports
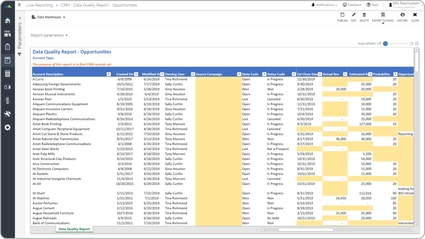
CRM Data Quality Report
Customer relationship management (CRM) They are often used by sales and marketing managers to ensure that data that is manually entered or uploaded to the CRM system is correct and consistent.
$