

Solver Marketplace
Explore based on functionality (reports, planning, and dashboard templates), or use the search function to filter by integration, industry, or to find a template that fits your specific needs. Save templates to your favorites list and use the "Share Favorites" link to share the list with others.
Icon Legend:
💲 Requires consulting hours to set up and configure
⭐ Save as a favorite and share with others
FUNCTIONALITY
- Reports
- Planning
- Dashboard
Data Source
Marketplace Data Source: Filter by Data Source to find assets specific to your system
Showcase Data Source: Filter by Data Source to find assets specific to your system
Industries
Marketplace Industries: Filter by Industries to find assets specific to your system
Showcase Industries: Filter by Industries to find assets specific to your system
industries
Marketplace Industries: Filter by your industry to find assets created for your specific needs
Showcase Industries: Filter by your industry to find assets created for your specific needs
559 - 564 of 868 Results
Favorite Page Results
Favorites


Reports
Reports
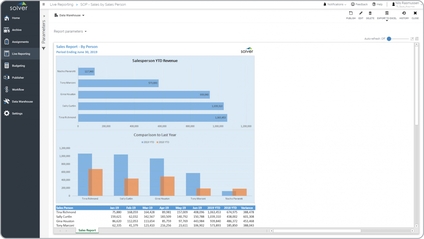
Sales Trend by Sales Person
Some of the key functionality in this category of analytical report is that it combines chart visualizations with a numerical report section.
$
Reports
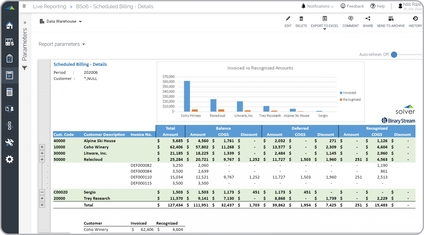
Scheduled Billing by Customer
Lists upcoming scheduled billing events by customer and contract, showing expected invoice dates and amounts. Used by billing and finance teams for revenue recognition planning and cash flow forecasting.
$
Reports
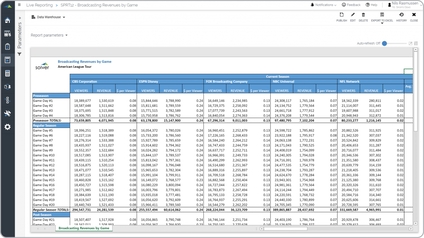
Sports – Broadcast Revenue Report
It shows detailed revenue and viewer figures per broadcaster and game. For each broadcaster (seen in the columns in the sample below) there are three columns:.
$
Reports
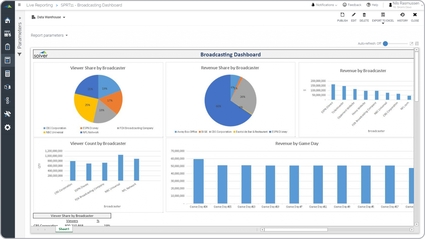
Sports – Broadcasting Dashboard
It provides graphical analysis from five different perspectives, including:. Viewer share by broadcaster,. Revenue share by broadcaster,.
$
Dashboard
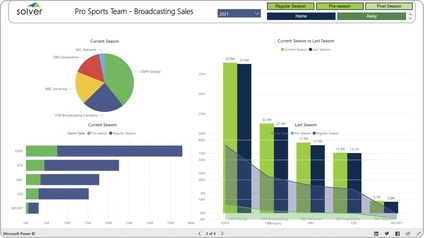
Sports – Broadcasting Sales
It provides analysis from three different perspectives:. Current season sales by broadcaster,. Regular versus pre-season sales - ranked by broadcaster,.
$