

Solver-markedsplads
Udforsk efter funktionalitet (rapporter, planlægning og dashboard-skabeloner), eller brug søgefunktionen til at filtrere efter integration, branche eller for at finde en skabelon, der passer til dine specifikke behov. Gem skabeloner på din favoritliste, og brug linket »Del favoritter« til at dele listen med andre.
Ikonforklaring:
💲 Kræver konsulenttimer til opsætning og konfiguration
⭐ Gem som favorit og del med andre
FUNCTIONALITY
- Reports
- Planning
- Dashboard
Data Source
Marketplace Data Source: Filter by Data Source to find assets specific to your system
Showcase Data Source: Filter by Data Source to find assets specific to your system
Industries
Marketplace Industries: Filter by Industries to find assets specific to your system
Showcase Industries: Filter by Industries to find assets specific to your system
industries
Marketplace Industries: Filter by your industry to find assets created for your specific needs
Showcase Industries: Filter by your industry to find assets created for your specific needs
553 - 558 of 868 Results
Favorite Page Results
Favorites


Dashboard
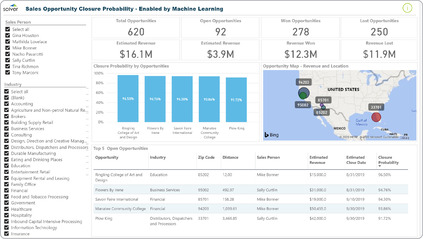
Sales Opportunity Analysis
It looks at a number of factors and then uses algorithms to rank all opportunities that a sales person should focus on first. These factors include.
$
Reports
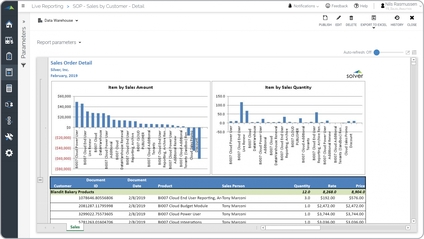
Sales Order Detail Report
Sales order detail reports are considered sales analysis- and data validation tools and are often used by sales managers and accountants to track and review sales transactions.
$
Reports
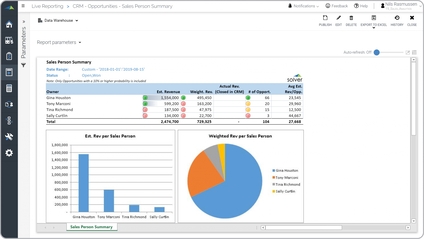
Sales Person Estimated Revenue
It is driven by date range parameters and other user-defined filters. The is based on Won and Open Opportunity data from the CRM system. Each sales person is listed down the rows with a grand total at the bottom.
$
Reports
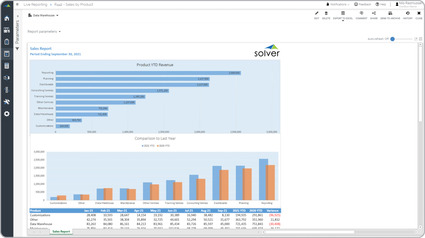
Sales Rank by Product
Ranks products by total sales revenue for the selected period with MTD, YTD, and trend data. Helps sales and product teams identify top performers and underperforming items.
$
Reports
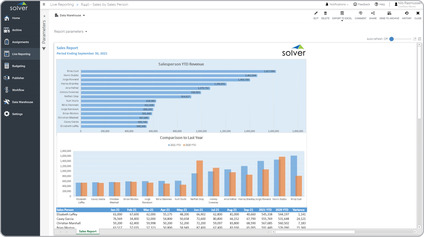
Sales Rank by Sales Person
Ranks sales persons by total revenue for the selected period with MTD and YTD comparisons. Used by sales managers for quota tracking, accountability, and incentive planning.
$
Dashboard
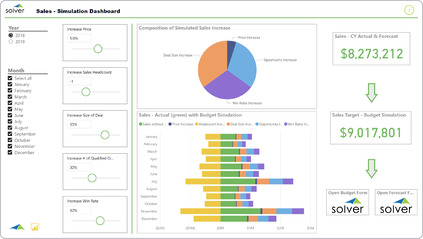
Sales Simulation
Some of the main functionality simulation dashboard is that it automatically combines actual year-to-date sales with forecast and provides interactive sliders where the user can simulate changes to various sales drivers.
$