

Solver-markedsplads
Udforsk efter funktionalitet (rapporter, planlægning og dashboard-skabeloner), eller brug søgefunktionen til at filtrere efter integration, branche eller for at finde en skabelon, der passer til dine specifikke behov. Gem skabeloner på din favoritliste, og brug linket »Del favoritter« til at dele listen med andre.
Ikonforklaring:
💲 Kræver konsulenttimer til opsætning og konfiguration
⭐ Gem som favorit og del med andre
FUNCTIONALITY
- Reports
- Planning
- Dashboard
Data Source
Marketplace Data Source: Filter by Data Source to find assets specific to your system
Showcase Data Source: Filter by Data Source to find assets specific to your system
Industries
Marketplace Industries: Filter by Industries to find assets specific to your system
Showcase Industries: Filter by Industries to find assets specific to your system
industries
Marketplace Industries: Filter by your industry to find assets created for your specific needs
Showcase Industries: Filter by your industry to find assets created for your specific needs
307 - 312 of 868 Results
Favorite Page Results
Favorites


Dashboard
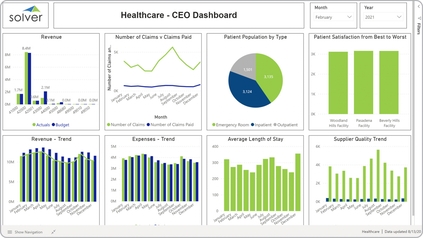
Healthcare – CEO Dashboard
It provides analysis from eight different perspectives, including:. Actual and budgeted revenues by GL account,. Monthly trend in number of claims versus claims paid,.
$
Dashboard
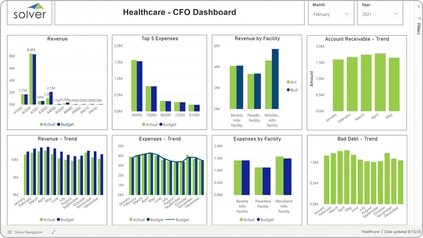
Healthcare – CFO Dashboard
Some of the main functionality in this dashboard is that it provides analysis from eight different perspectives, including:. Actual and budgeted revenues by GL account,. Top 5 expenses - actual and budget,.
$
Dashboard
Dashboard
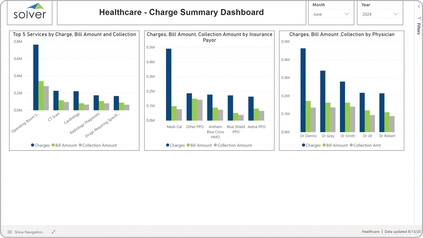
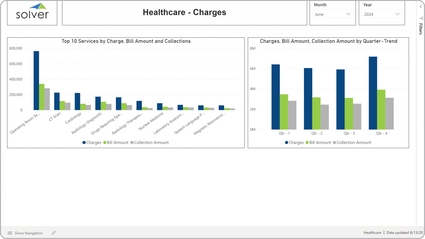
Healthcare – Charges Dashboard
It provides analysis from two perspectives:. Top 10 services ranked and compared to billed and collected amounts, and. Quarter by quarter comparison of charges, billings and collections.
$
Reports
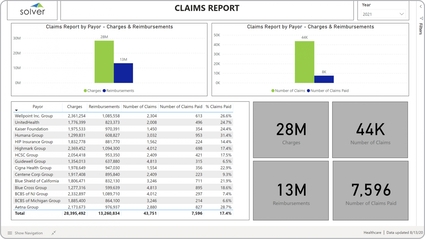
Healthcare – Claims Analysis
It uses KPIs, a matrix and charts to provide analysis in seven areas:. Total charges and reimbursement amounts,. Number of claims and claims paid,.
$
Reports
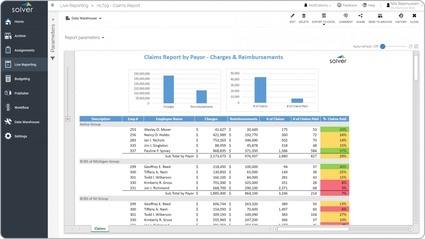
Healthcare – Claims by Payor
It shows claims-related information by employee and insurance provider (payor). The metrics include charges, reimbursements, # of claims, # of claims paid, and % of claims paid.
$