

Solver-markedsplads
Udforsk efter funktionalitet (rapporter, planlægning og dashboard-skabeloner), eller brug søgefunktionen til at filtrere efter integration, branche eller for at finde en skabelon, der passer til dine specifikke behov. Gem skabeloner på din favoritliste, og brug linket »Del favoritter« til at dele listen med andre.
Ikonforklaring:
💲 Kræver konsulenttimer til opsætning og konfiguration
⭐ Gem som favorit og del med andre
FUNCTIONALITY
- Reports
- Planning
- Dashboard
Data Source
Marketplace Data Source: Filter by Data Source to find assets specific to your system
Showcase Data Source: Filter by Data Source to find assets specific to your system
Industries
Marketplace Industries: Filter by Industries to find assets specific to your system
Showcase Industries: Filter by Industries to find assets specific to your system
industries
Marketplace Industries: Filter by your industry to find assets created for your specific needs
Showcase Industries: Filter by your industry to find assets created for your specific needs
817 - 822 of 868 Results
Favorite Page Results
Favorites


Reports
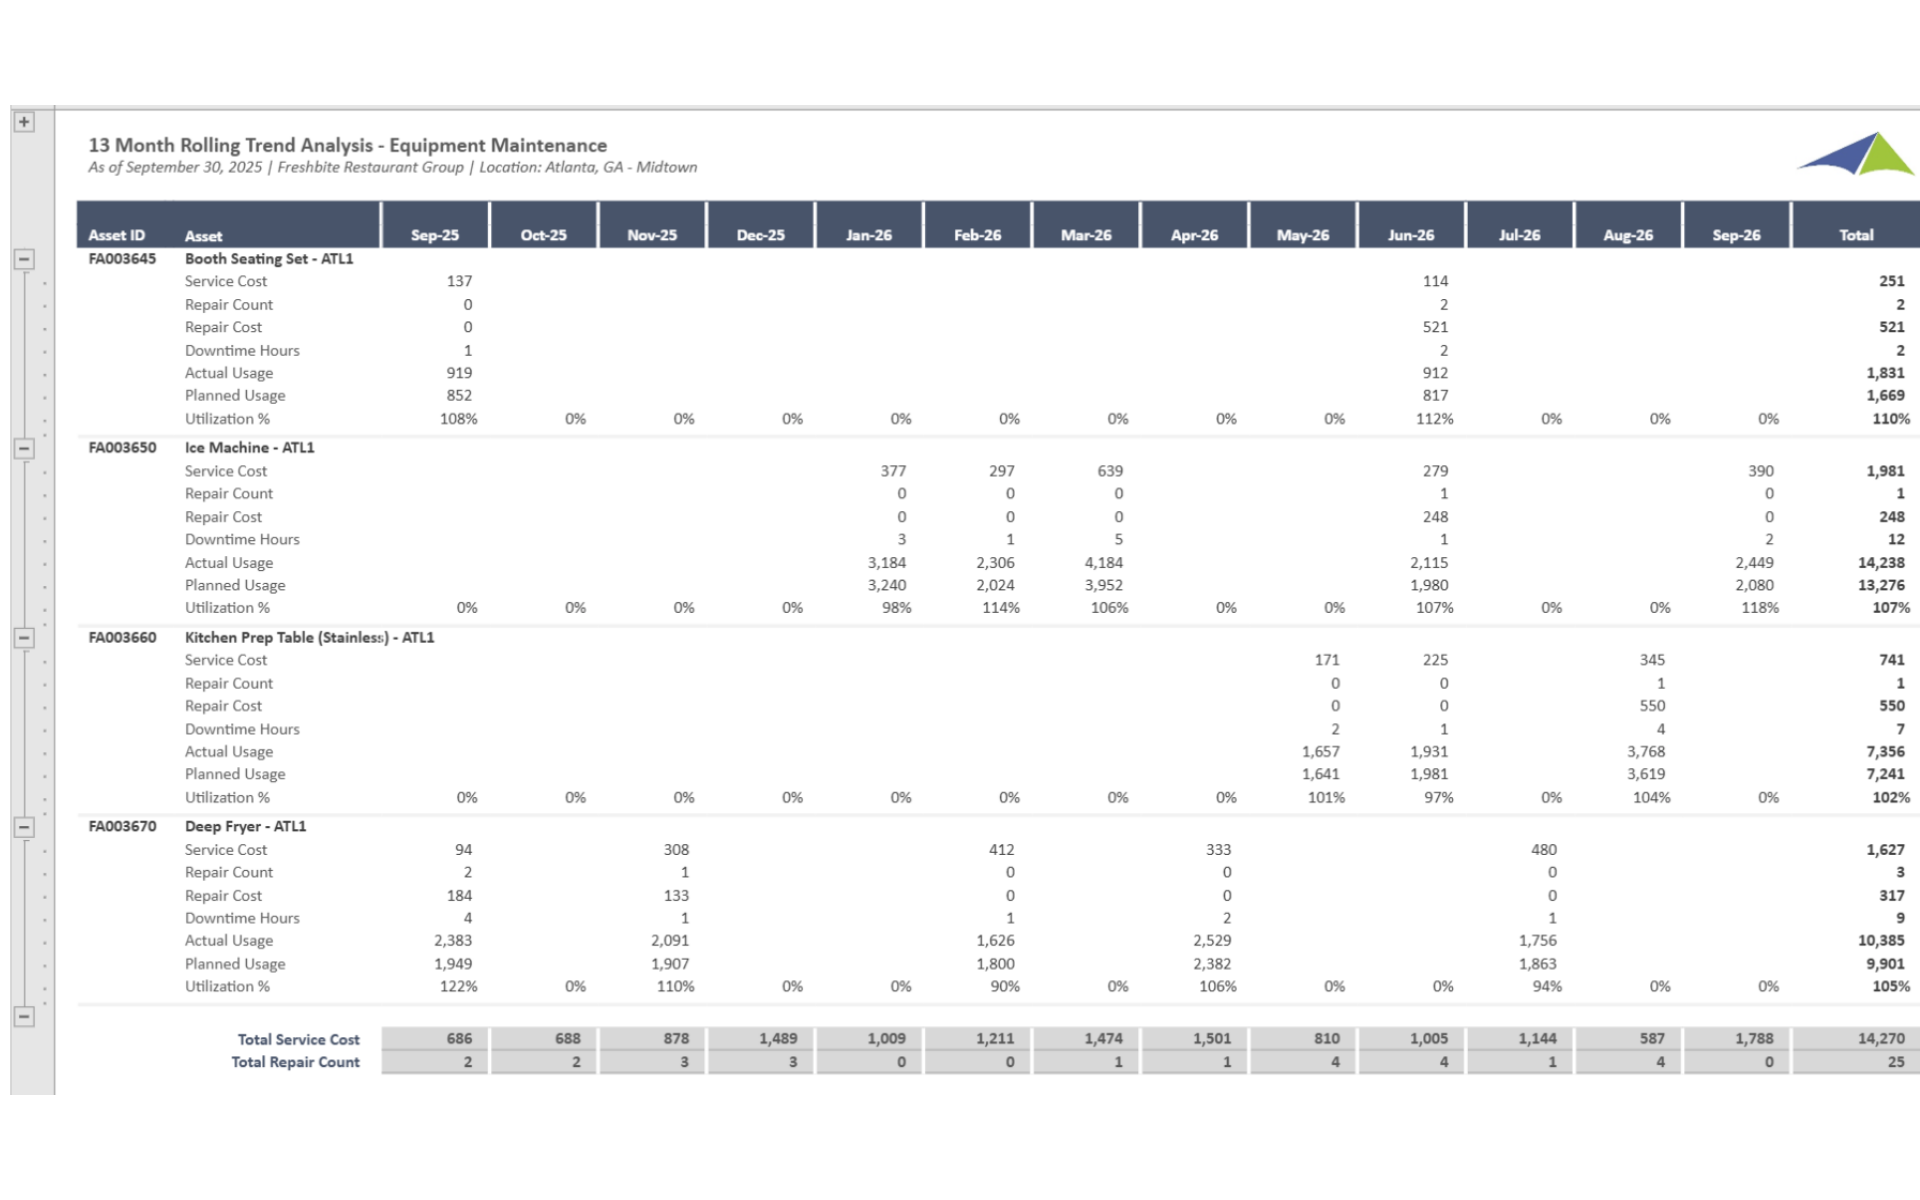
Retail - Restaurant – 13 Month Rolling Trend Analysis – Equipment Maintenance
Tracks 13 months of rolling equipment maintenance activity including repair costs, maintenance frequency, and downtime by equipment type and location, enabling operators to identify aging equipment and predict maintenance needs proactively.
$
Reports
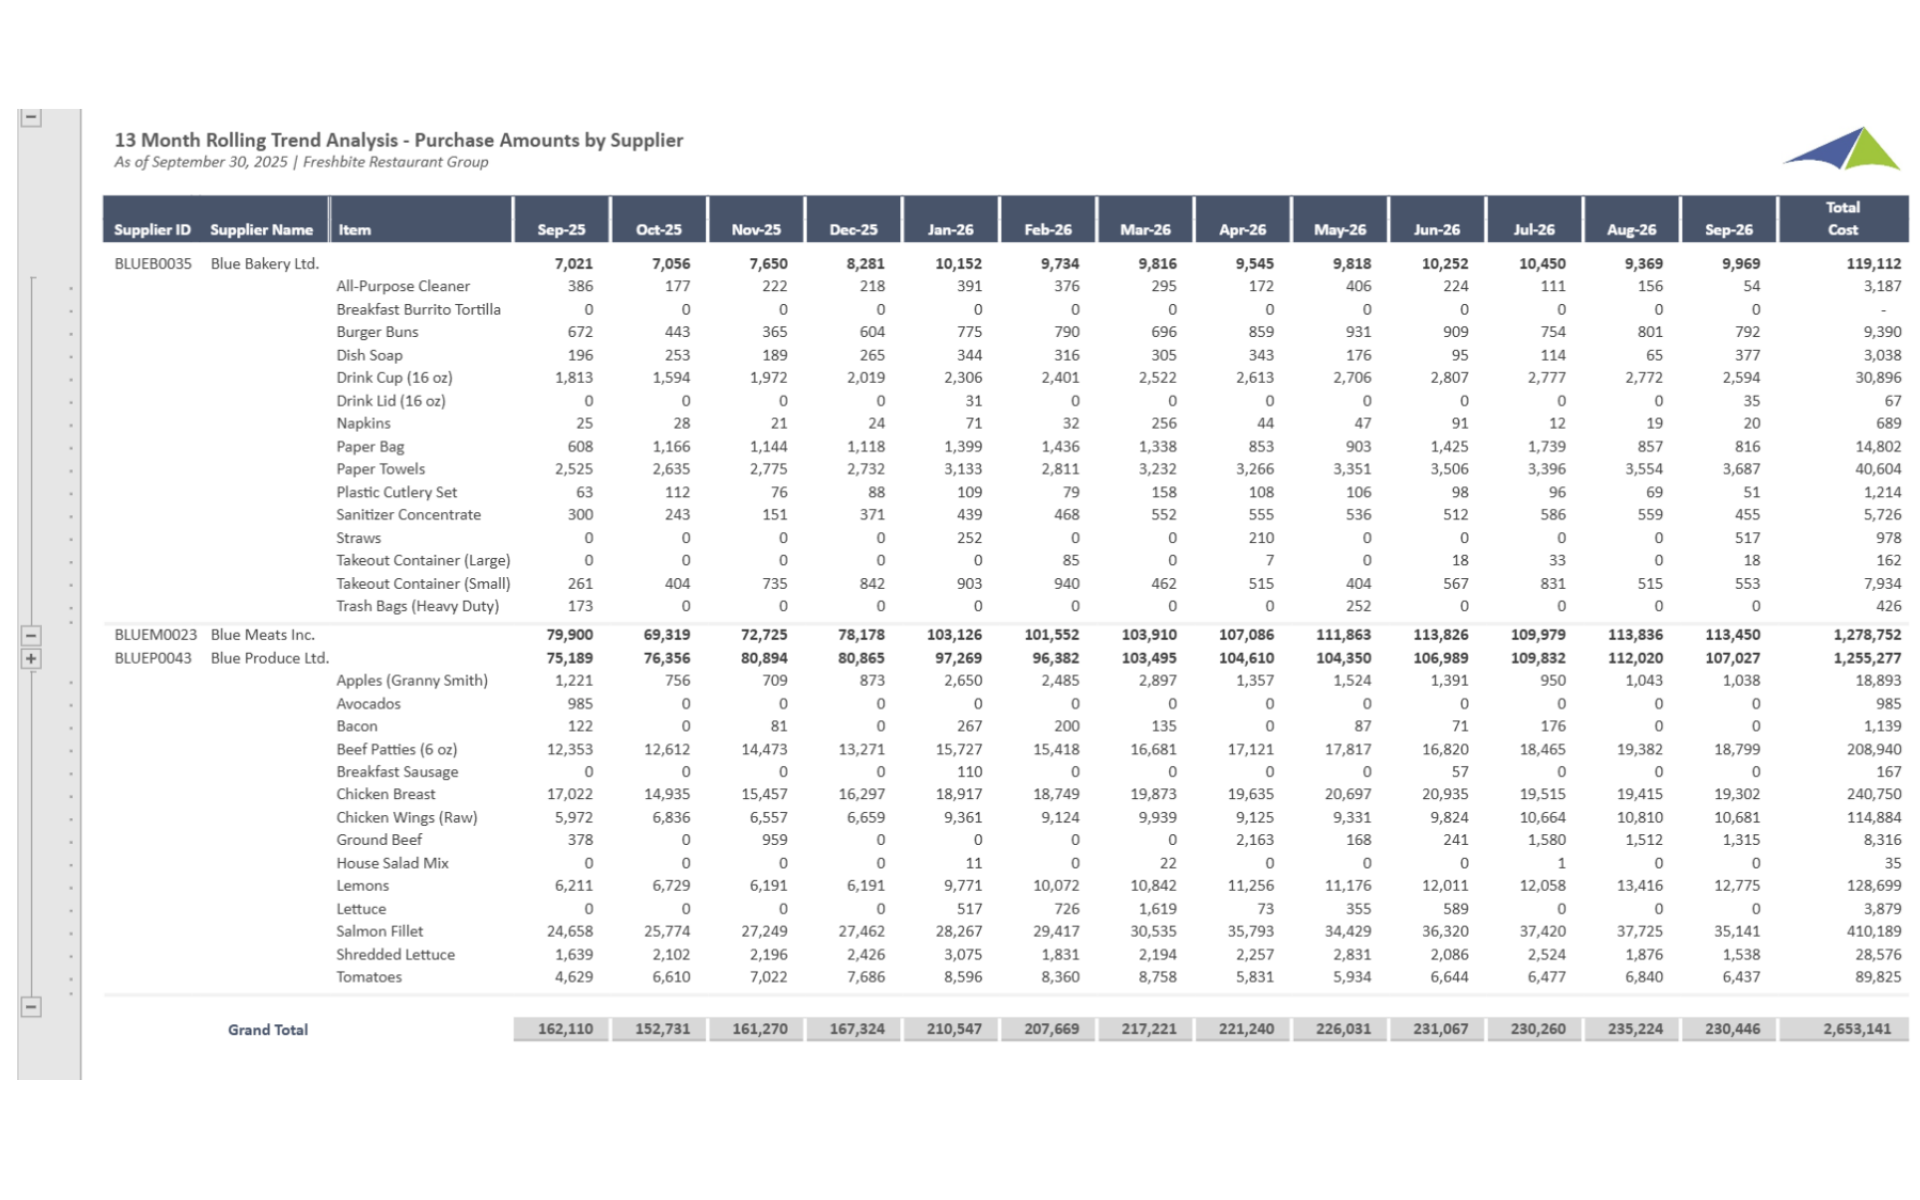
Retail - Restaurant – 13 Month Rolling Trend Analysis – Purchase Orders – Purchase Amounts by Supplier
Tracks 13 months of rolling purchase order amounts by supplier across all locations, enabling procurement teams to monitor supplier spending trends, identify concentration risk, and optimize purchasing across the restaurant portfolio.
$
Reports
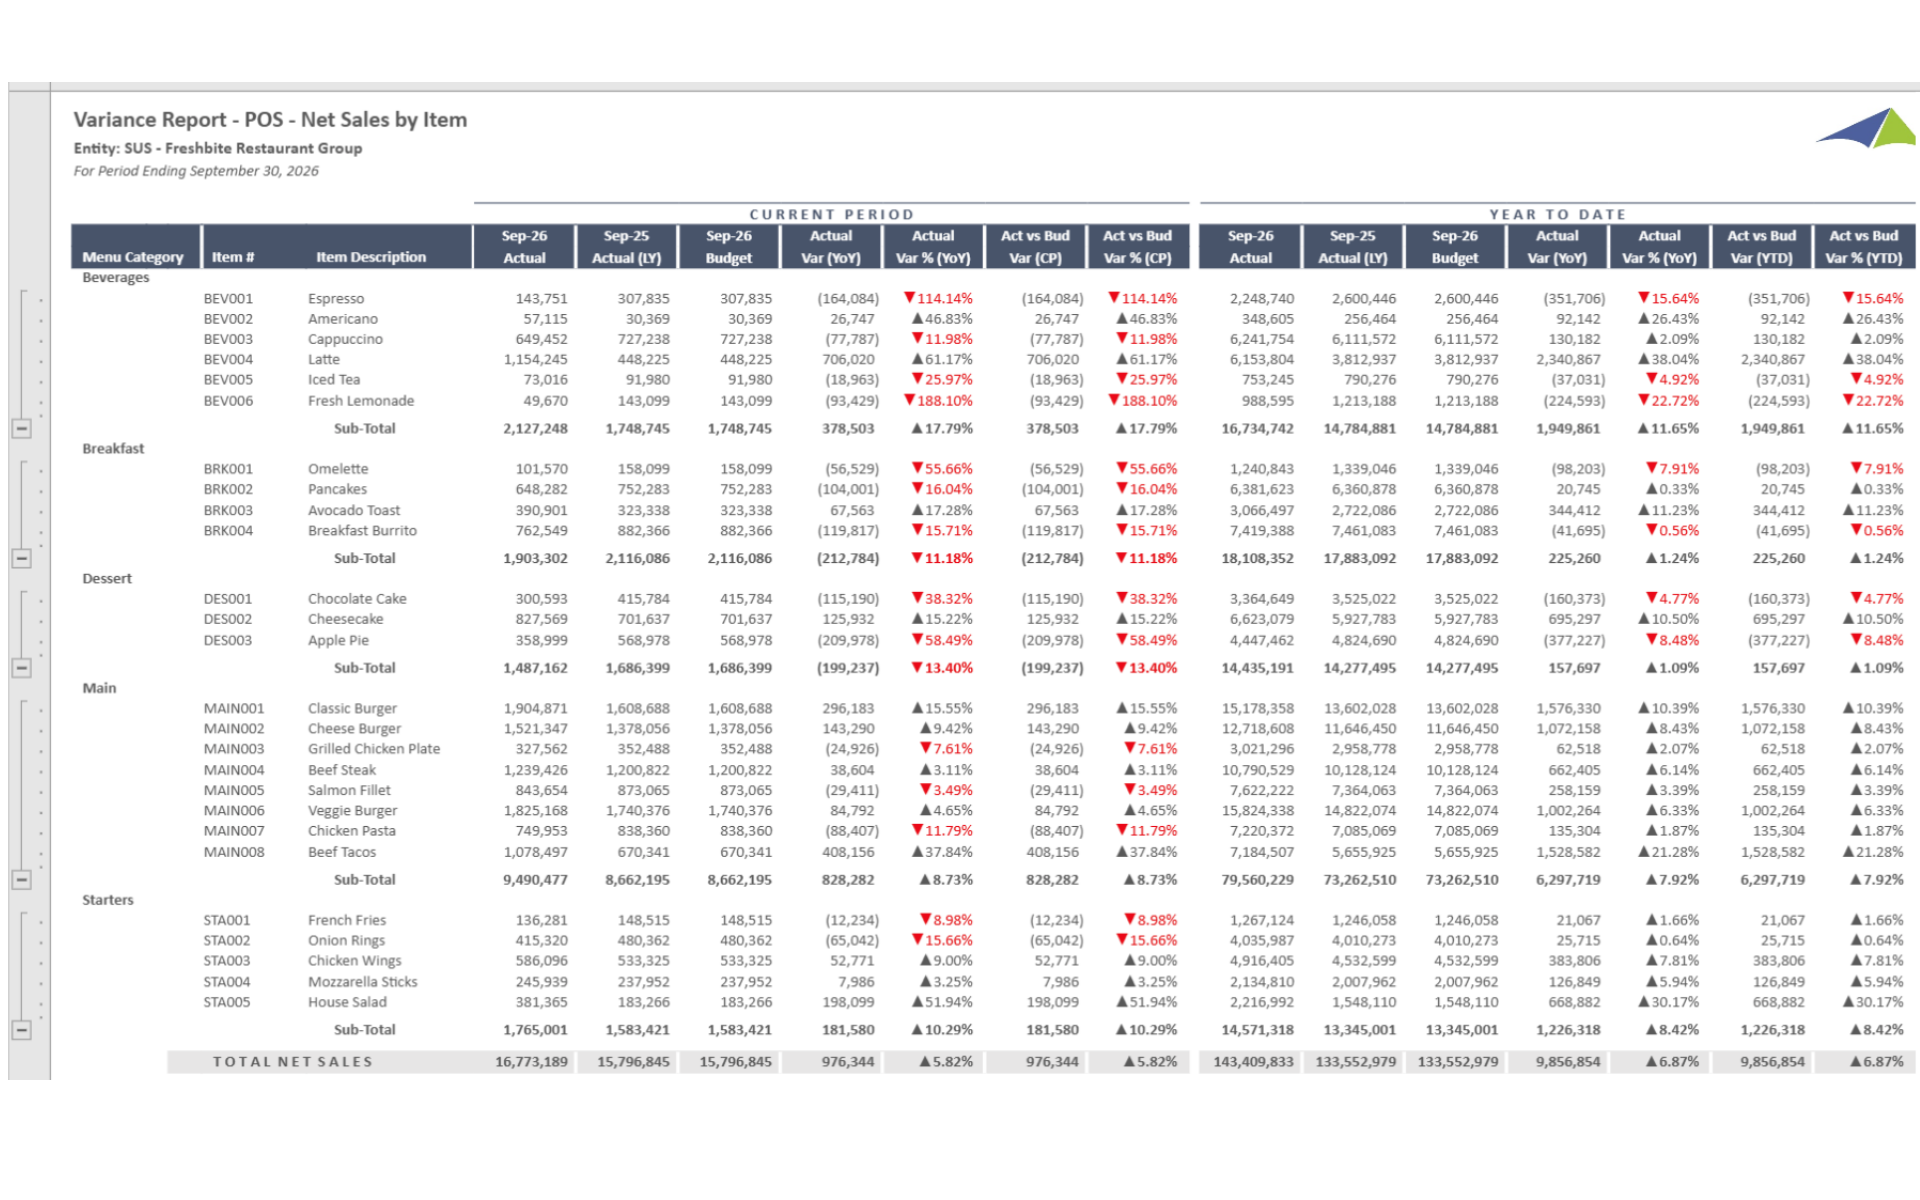
Retail - Restaurant – Variance Report – POS – Sales by Item
Analyzes POS sales variance at the individual menu item level comparing actual item sales volumes and revenue to budget and prior year across all locations, identifying which items are over- or under-performing against plan.
$
Reports
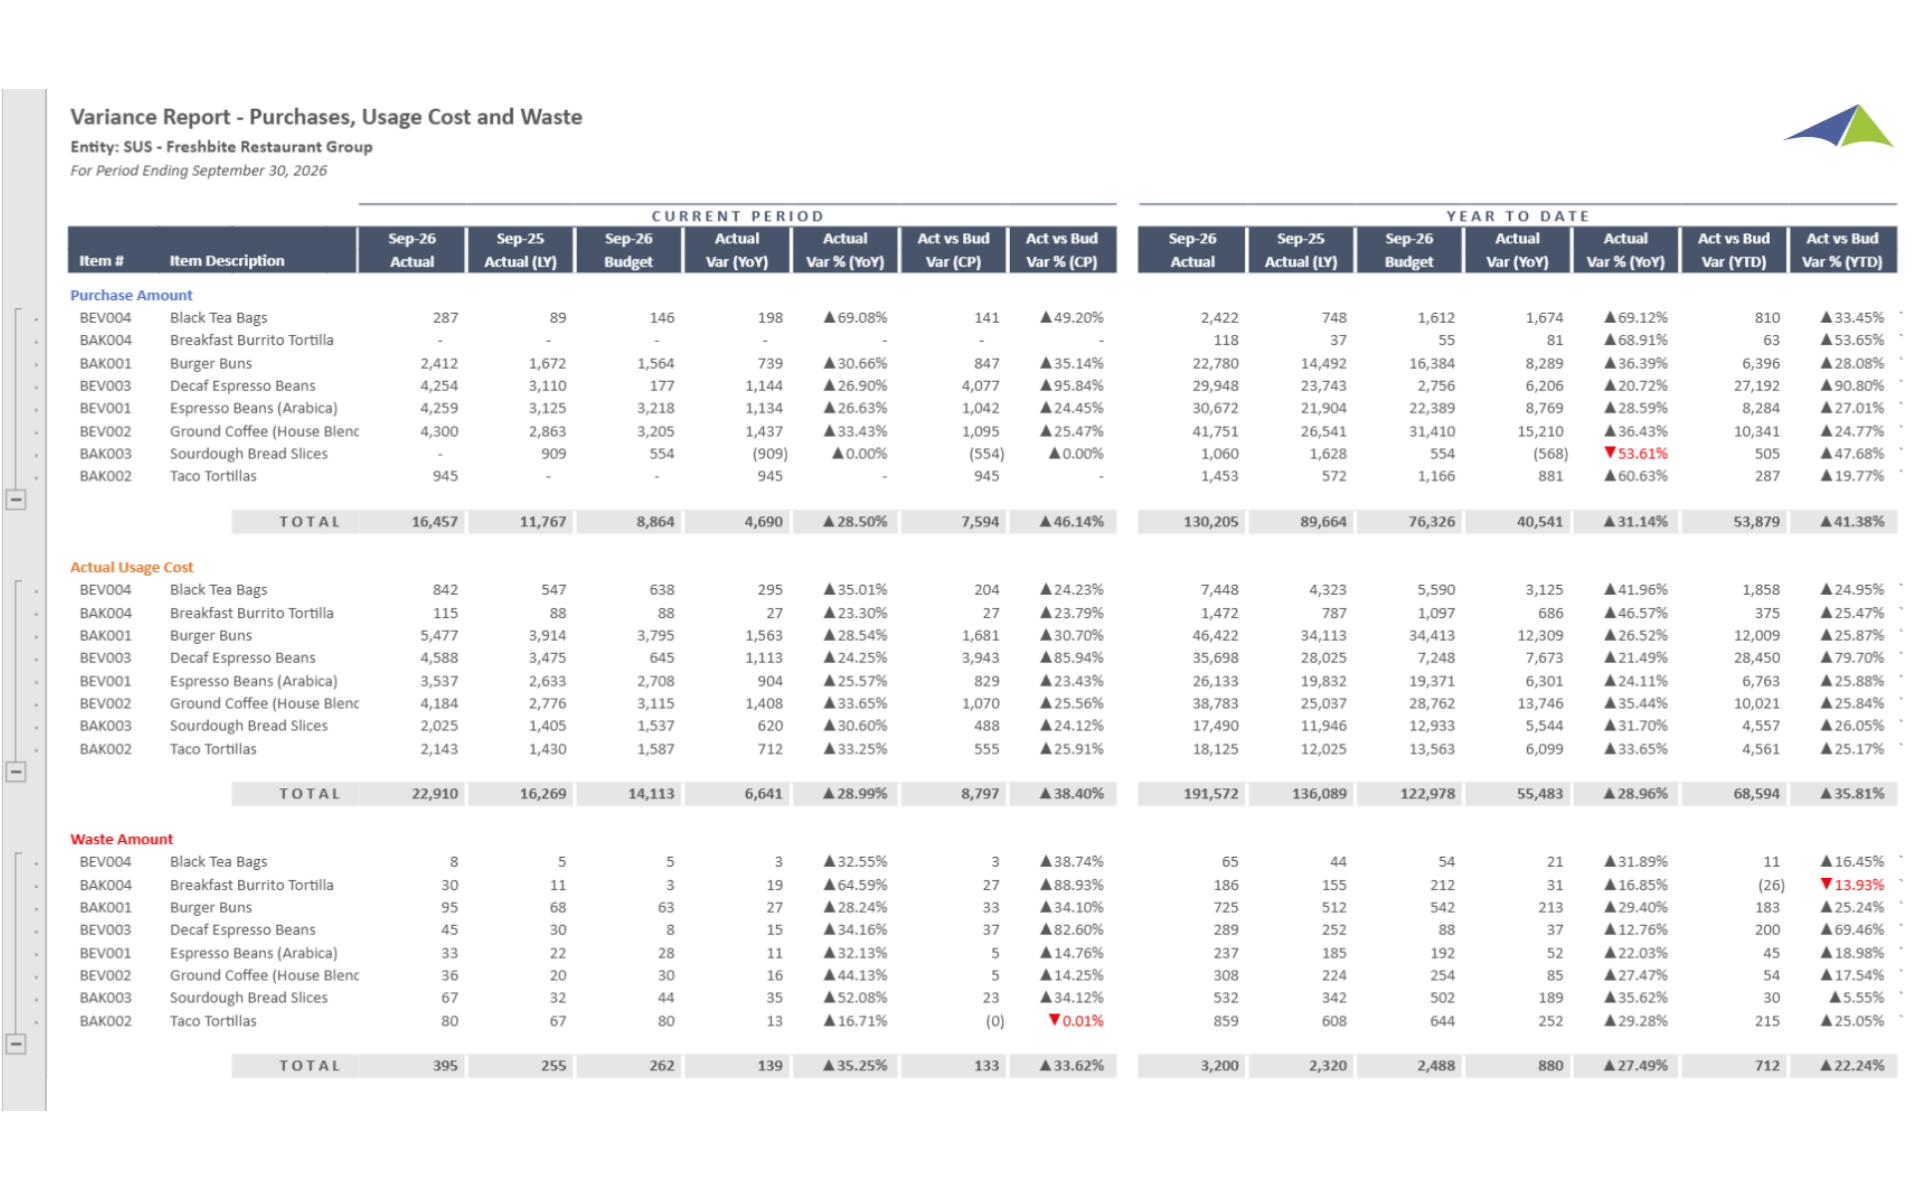
Retail - Restaurant – Variance Report – Inventory – Purchases, Usage Cost and Waste
Analyzes inventory variance across three dimensions — purchase costs vs. budget, actual usage cost vs. theoretical, and waste — enabling operators to identify the specific source of food cost overruns at each location.
$
Reports
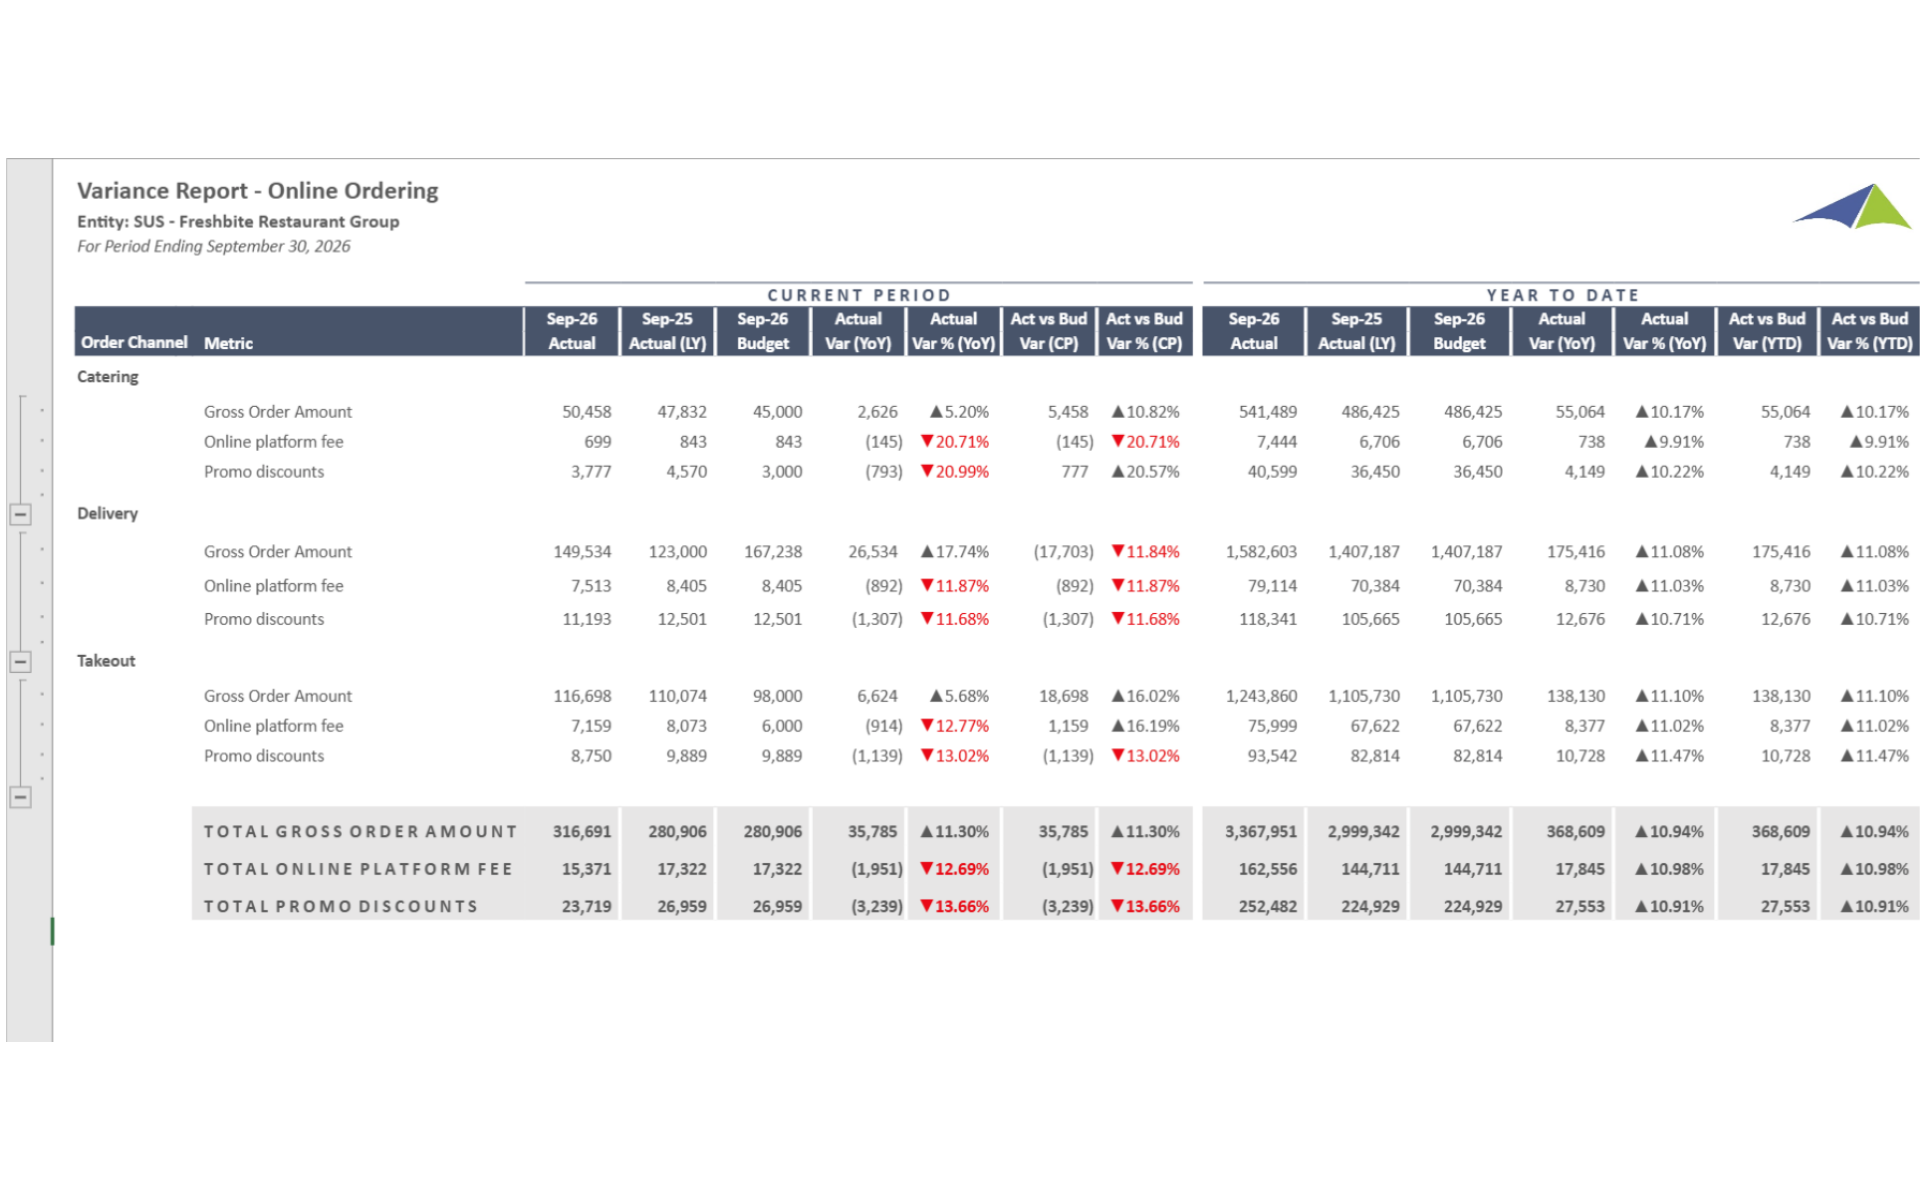
Retail - Restaurant – Variance Report – Online Ordering
Analyzes online ordering channel variance comparing actual online order volume, revenue, and average check size to budget and prior year, enabling operators to evaluate digital ordering performance and identify locations where adoption is lagging.
$
Reports
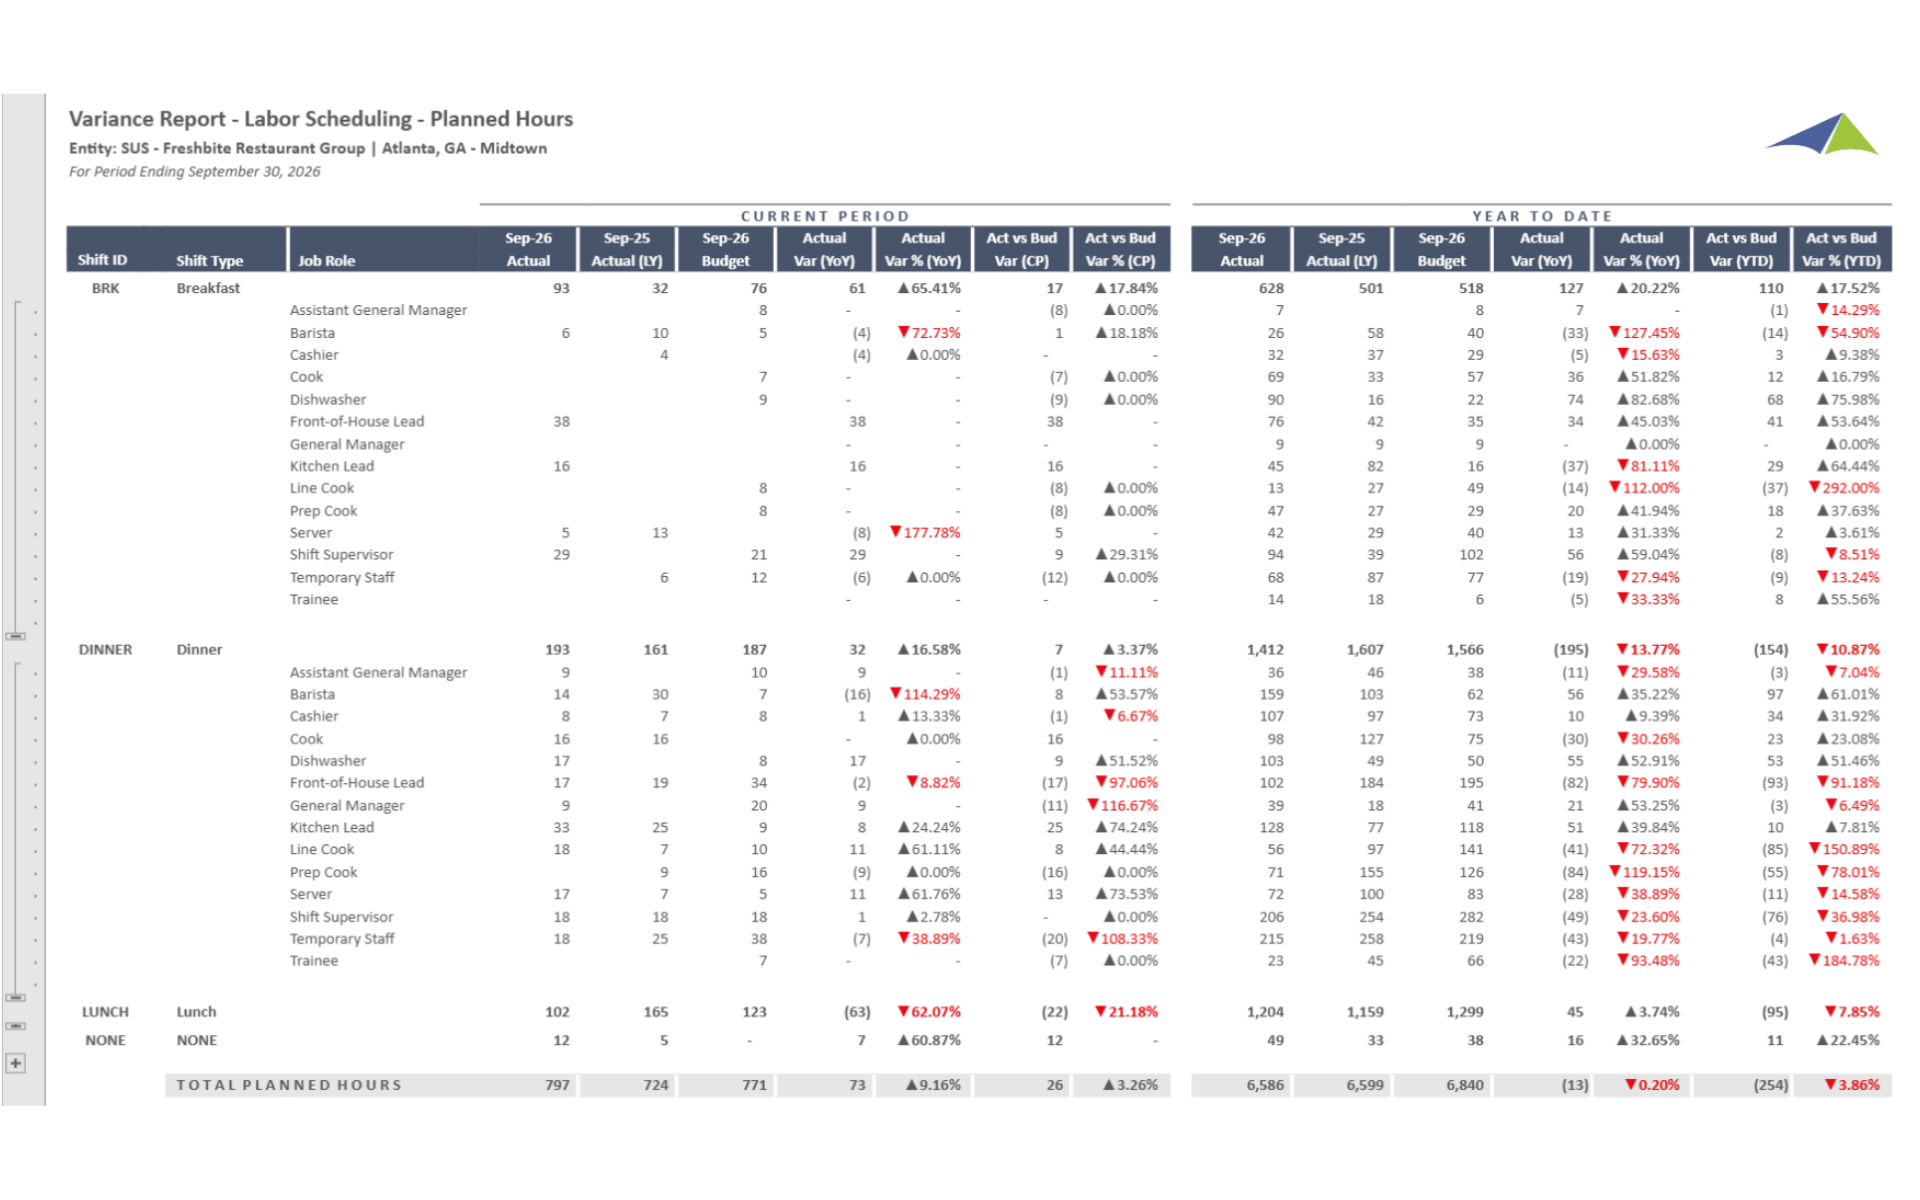
Retail - Restaurant – Variance Report – Labor Scheduling
Analyzes labor scheduling variance comparing scheduled hours and labor cost targets to actual outcomes, enabling managers to identify locations where scheduling is consistently over or under the optimal labor model.
$