

Solver-markedsplads
Udforsk efter funktionalitet (rapporter, planlægning og dashboard-skabeloner), eller brug søgefunktionen til at filtrere efter integration, branche eller for at finde en skabelon, der passer til dine specifikke behov. Gem skabeloner på din favoritliste, og brug linket »Del favoritter« til at dele listen med andre.
Ikonforklaring:
💲 Kræver konsulenttimer til opsætning og konfiguration
⭐ Gem som favorit og del med andre
FUNCTIONALITY
- Reports
- Planning
- Dashboard
Data Source
Marketplace Data Source: Filter by Data Source to find assets specific to your system
Showcase Data Source: Filter by Data Source to find assets specific to your system
Industries
Marketplace Industries: Filter by Industries to find assets specific to your system
Showcase Industries: Filter by Industries to find assets specific to your system
industries
Marketplace Industries: Filter by your industry to find assets created for your specific needs
Showcase Industries: Filter by your industry to find assets created for your specific needs
811 - 816 of 868 Results
Favorite Page Results
Favorites


Reports
Retail - Restaurant – 13 Month Rolling Trend Analysis – Time & Attendance
Tracks 13 months of rolling time and attendance data including total hours worked, overtime, absenteeism, and labor cost per cover, enabling operators to identify labor efficiency trends and seasonal patterns across all restaurant locations.
$
Reports
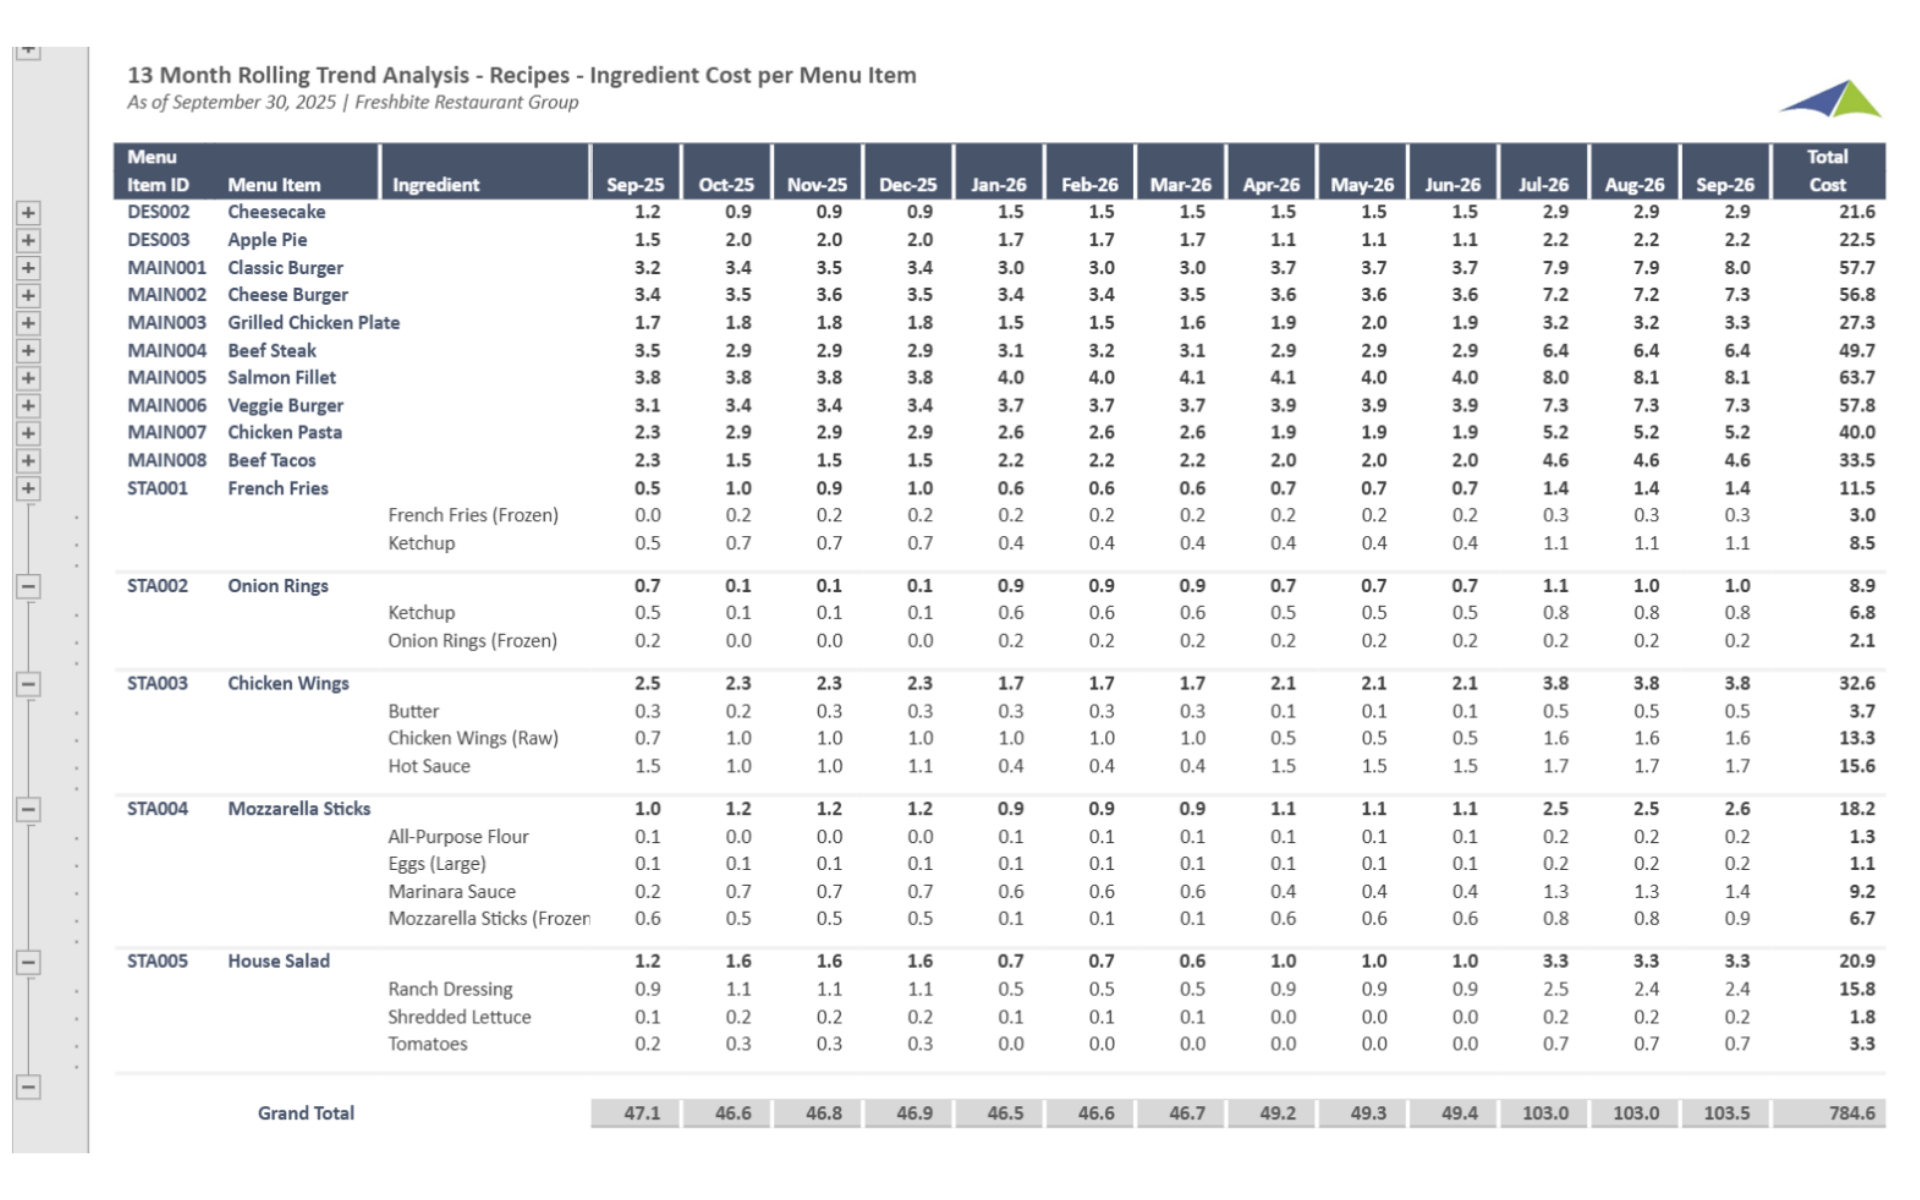
Retail - Restaurant – 13 Month Rolling Trend Analysis – Recipes – Cost per Menu Item
Tracks 13 months of rolling recipe cost trends by menu item, enabling culinary and finance teams to monitor how ingredient cost changes impact cost per menu item and identify items trending out of acceptable ranges.
$
Reports
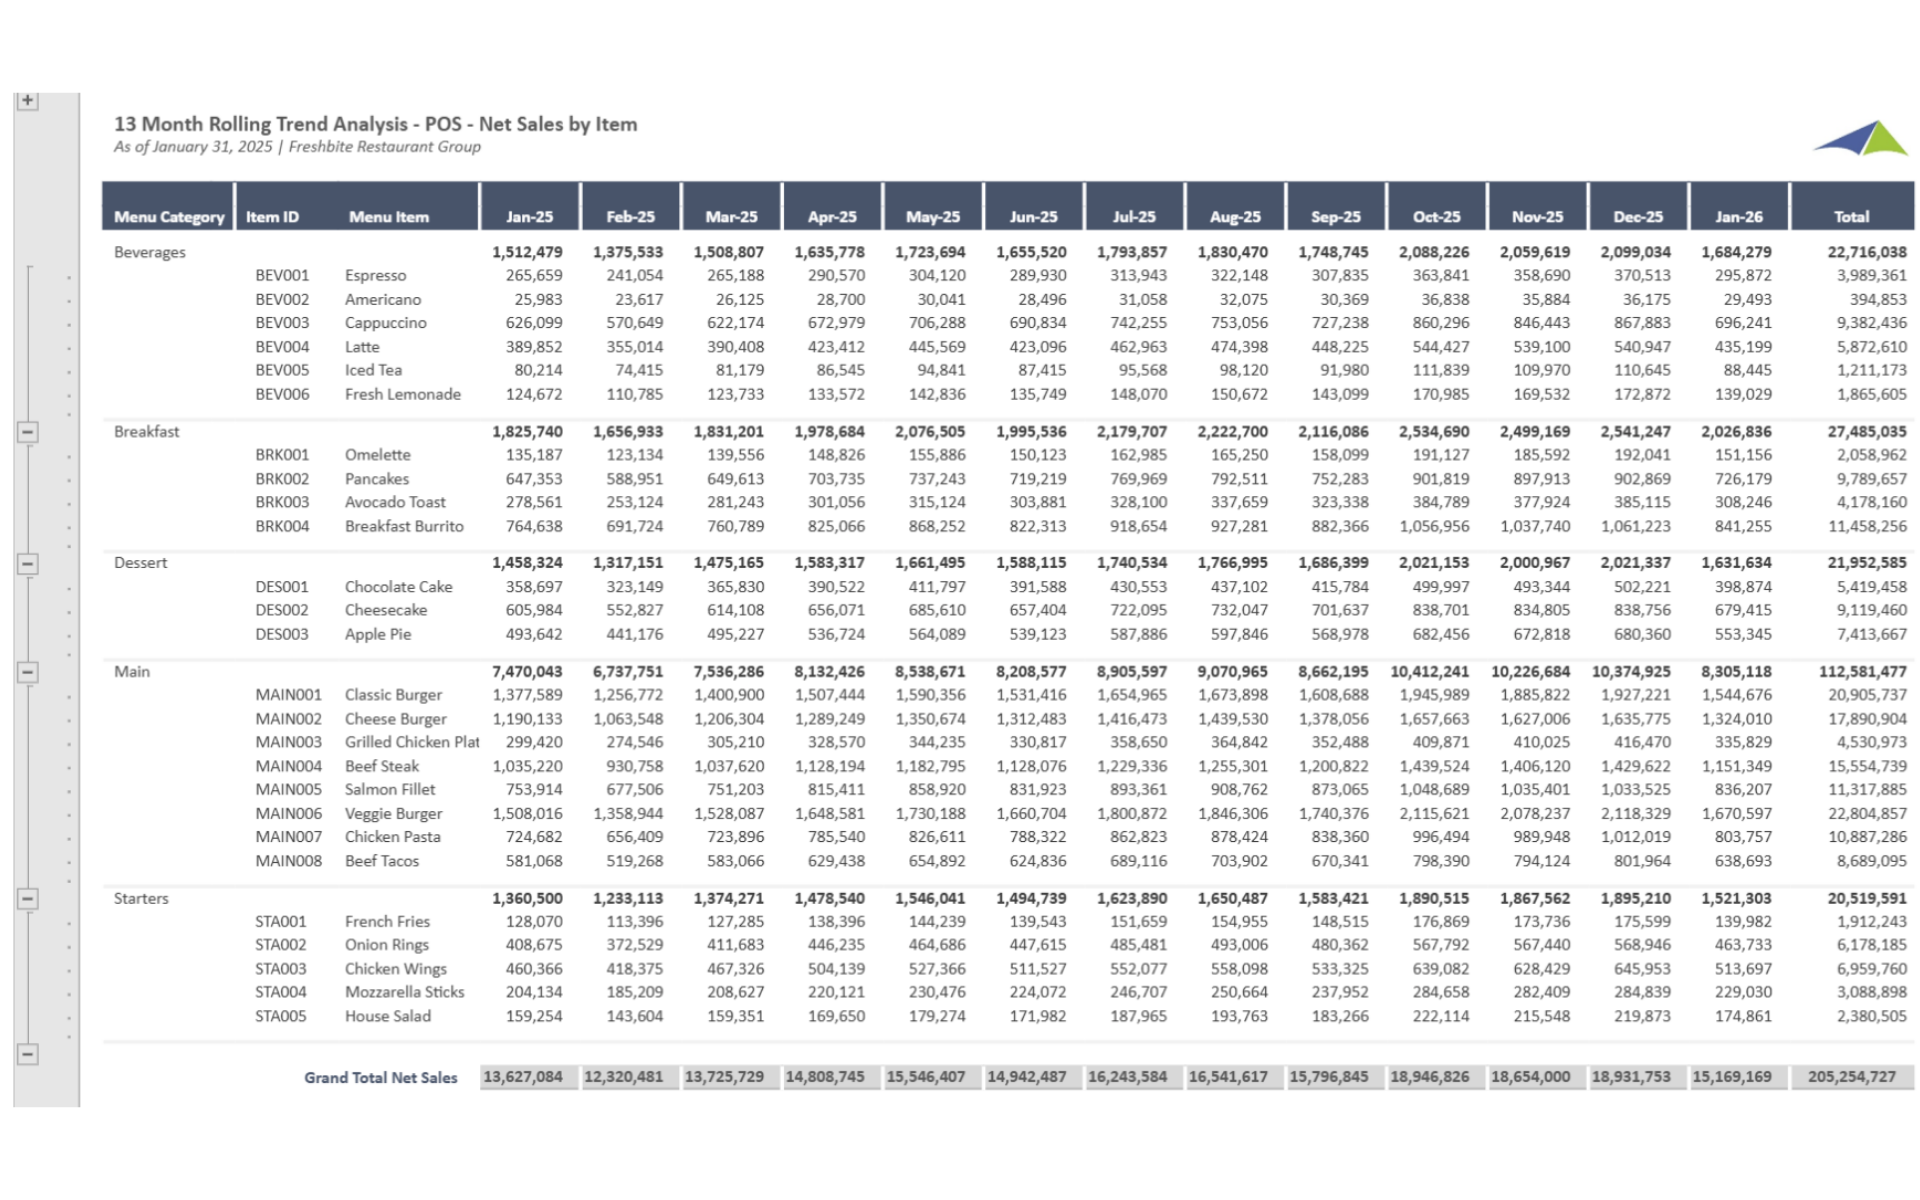
Retail - Restaurant – 13 Month Rolling Trend Analysis – POS – Sales by Item
Tracks 13 months of rolling POS sales trends at the individual menu item level showing sales volume, revenue, and mix percentage by item across all locations, enabling operators to identify sales trend shifts and seasonal demand patterns.
$
Reports
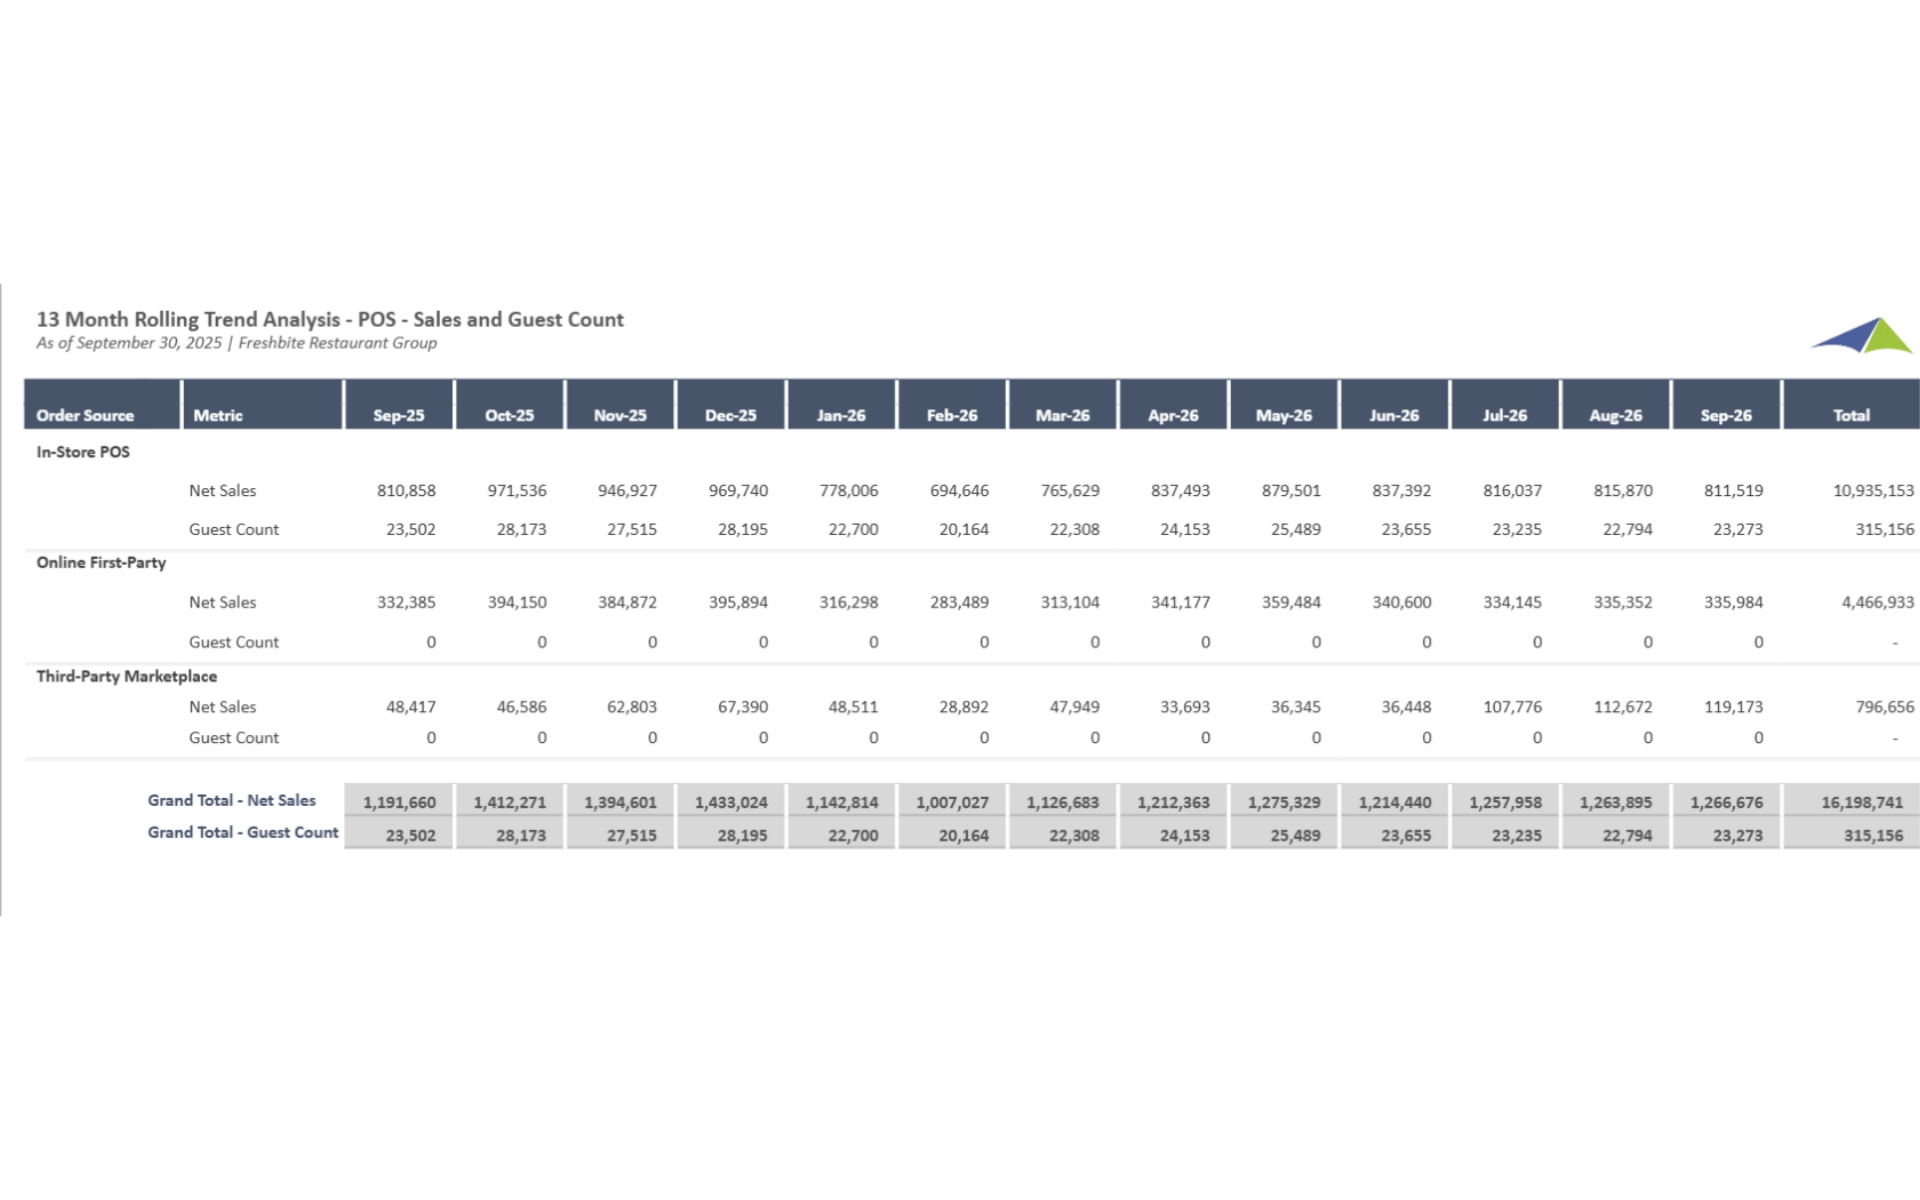
Retail - Restaurant – 13 Month Rolling Trend Analysis – POS – Sales by Order Source
Tracks 13 months of rolling POS revenue trends by order source including dine-in, takeout, delivery, and online ordering, enabling operators to identify channel mix shifts and develop targeted channel growth strategies.
$
Reports
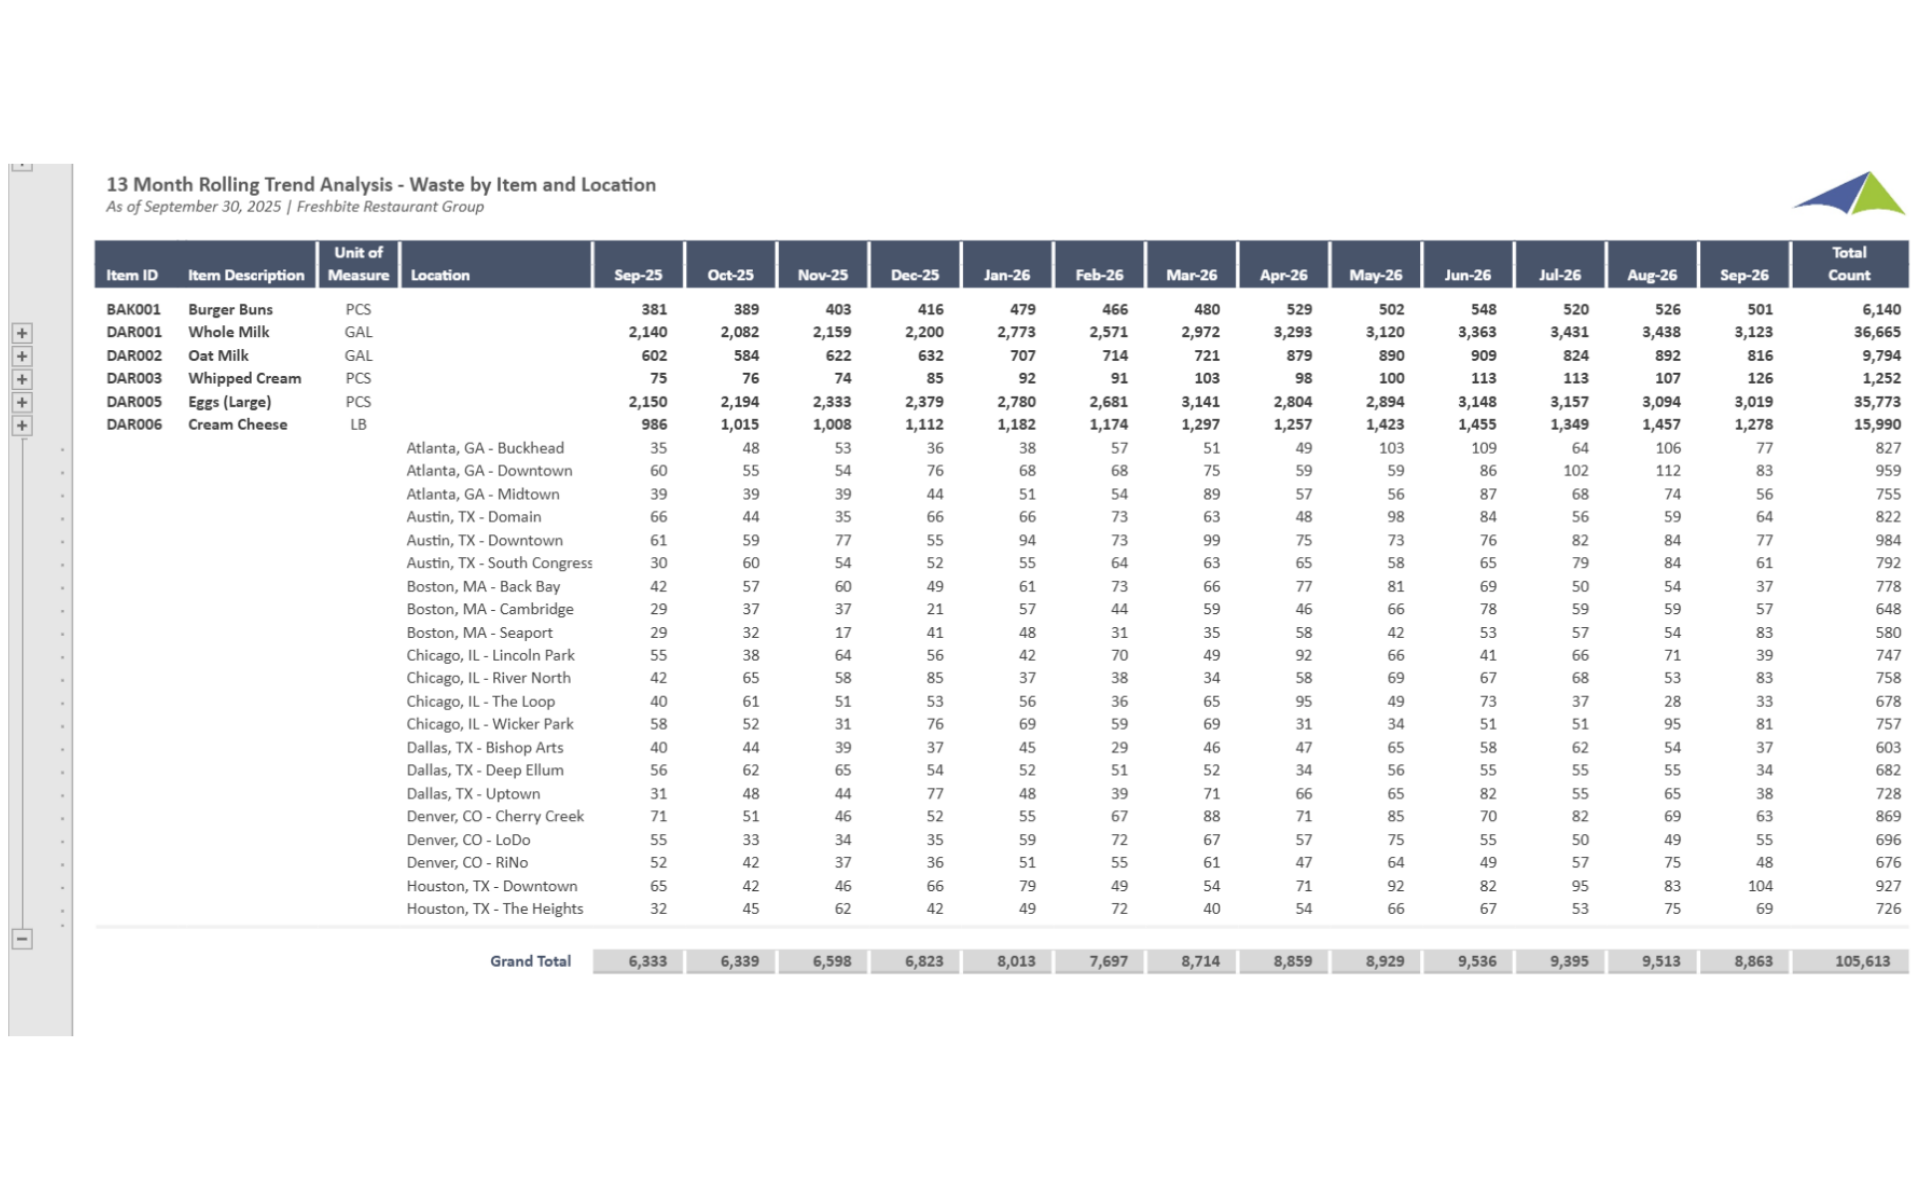
Retail - Restaurant – 13 Month Rolling Trend Analysis – Inventory – Waste by Item and Location
Tracks 13 months of rolling food waste trends by ingredient, menu item, and location, enabling operators to identify persistent waste patterns and target reduction initiatives where they will have the greatest impact.
$
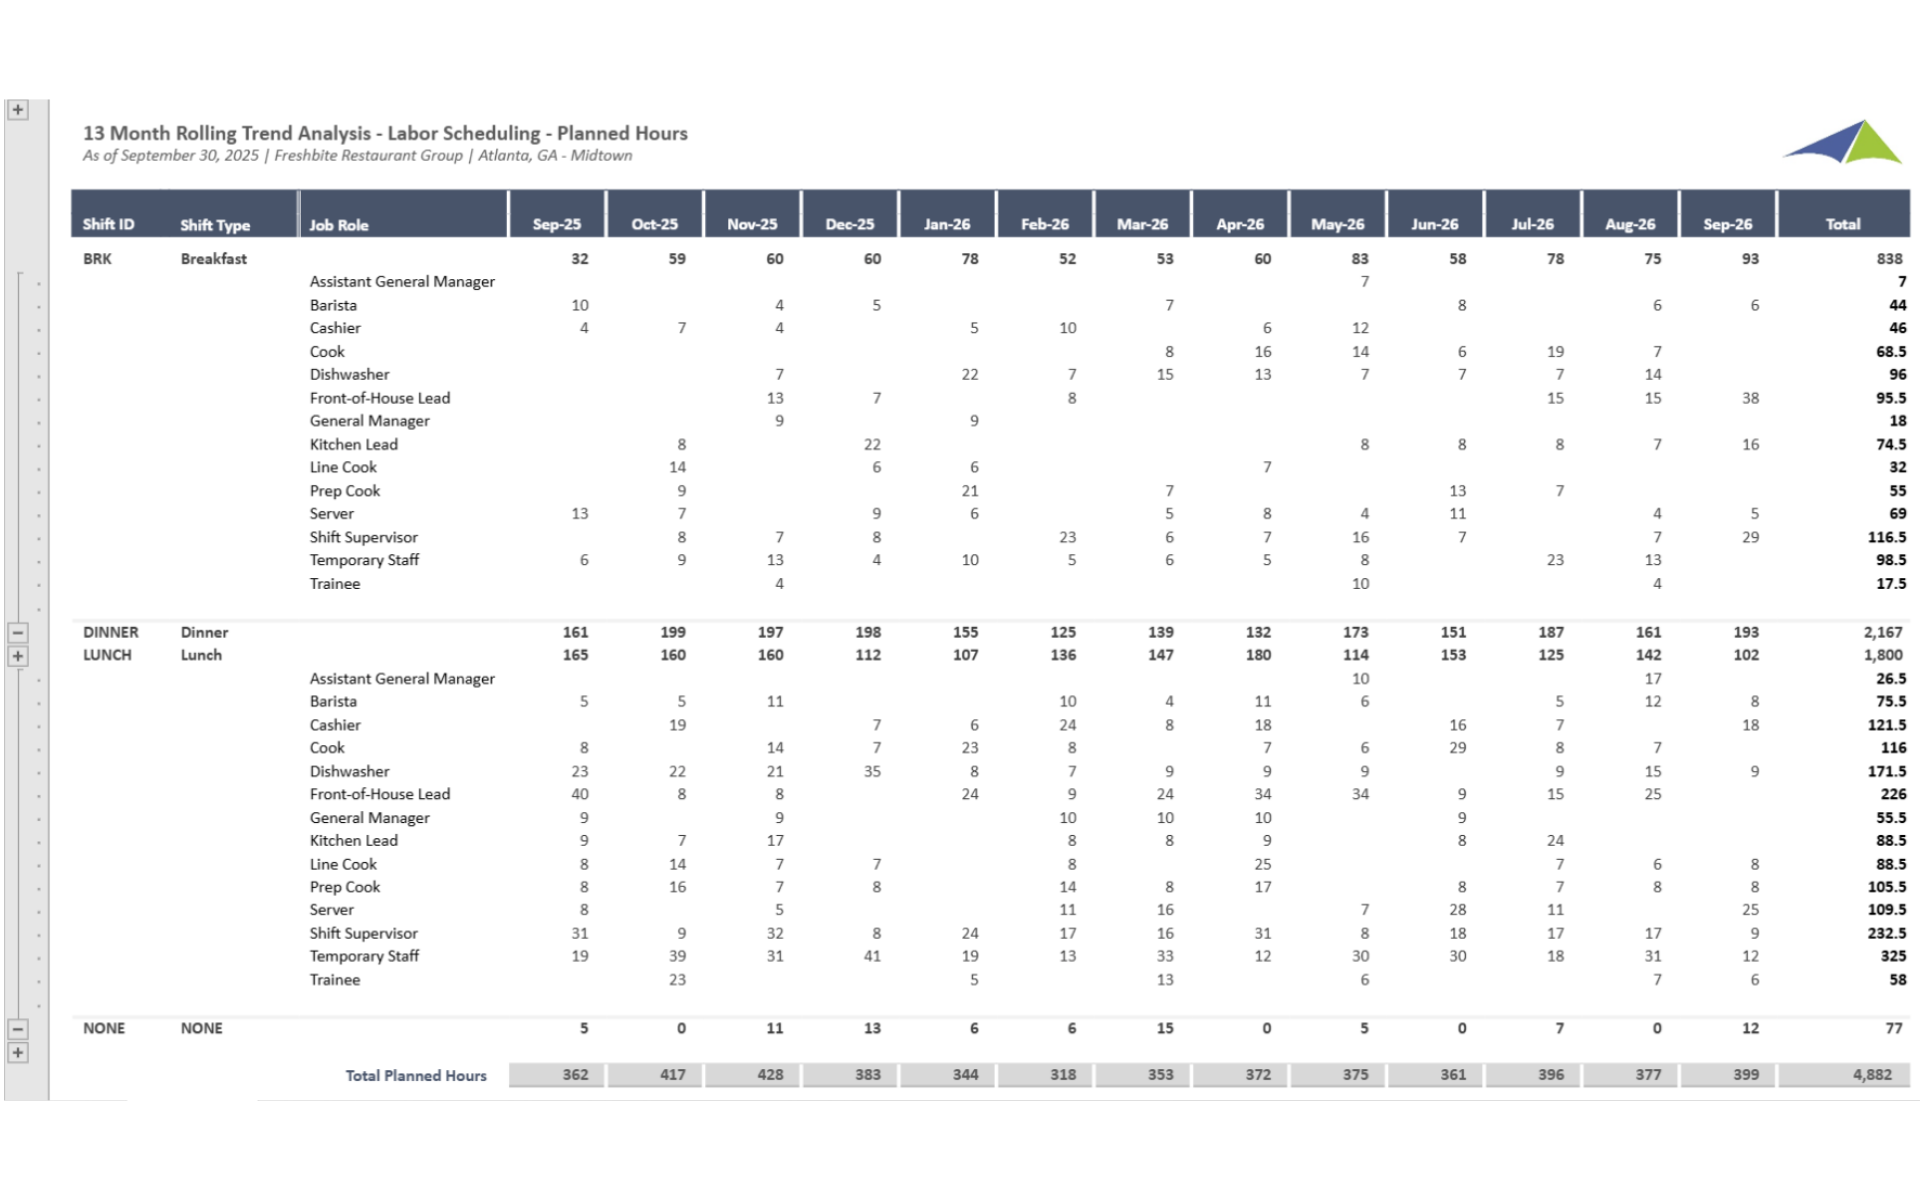
Reports
Retail - Restaurant – 13 Month Rolling Trend Analysis – Labor Scheduling
Tracks 13 months of rolling labor scheduling performance including scheduled vs. actual hours, labor cost as a percentage of sales, and staffing coverage by daypart, enabling operators to identify scheduling inefficiencies across all locations.
$