
What is
a
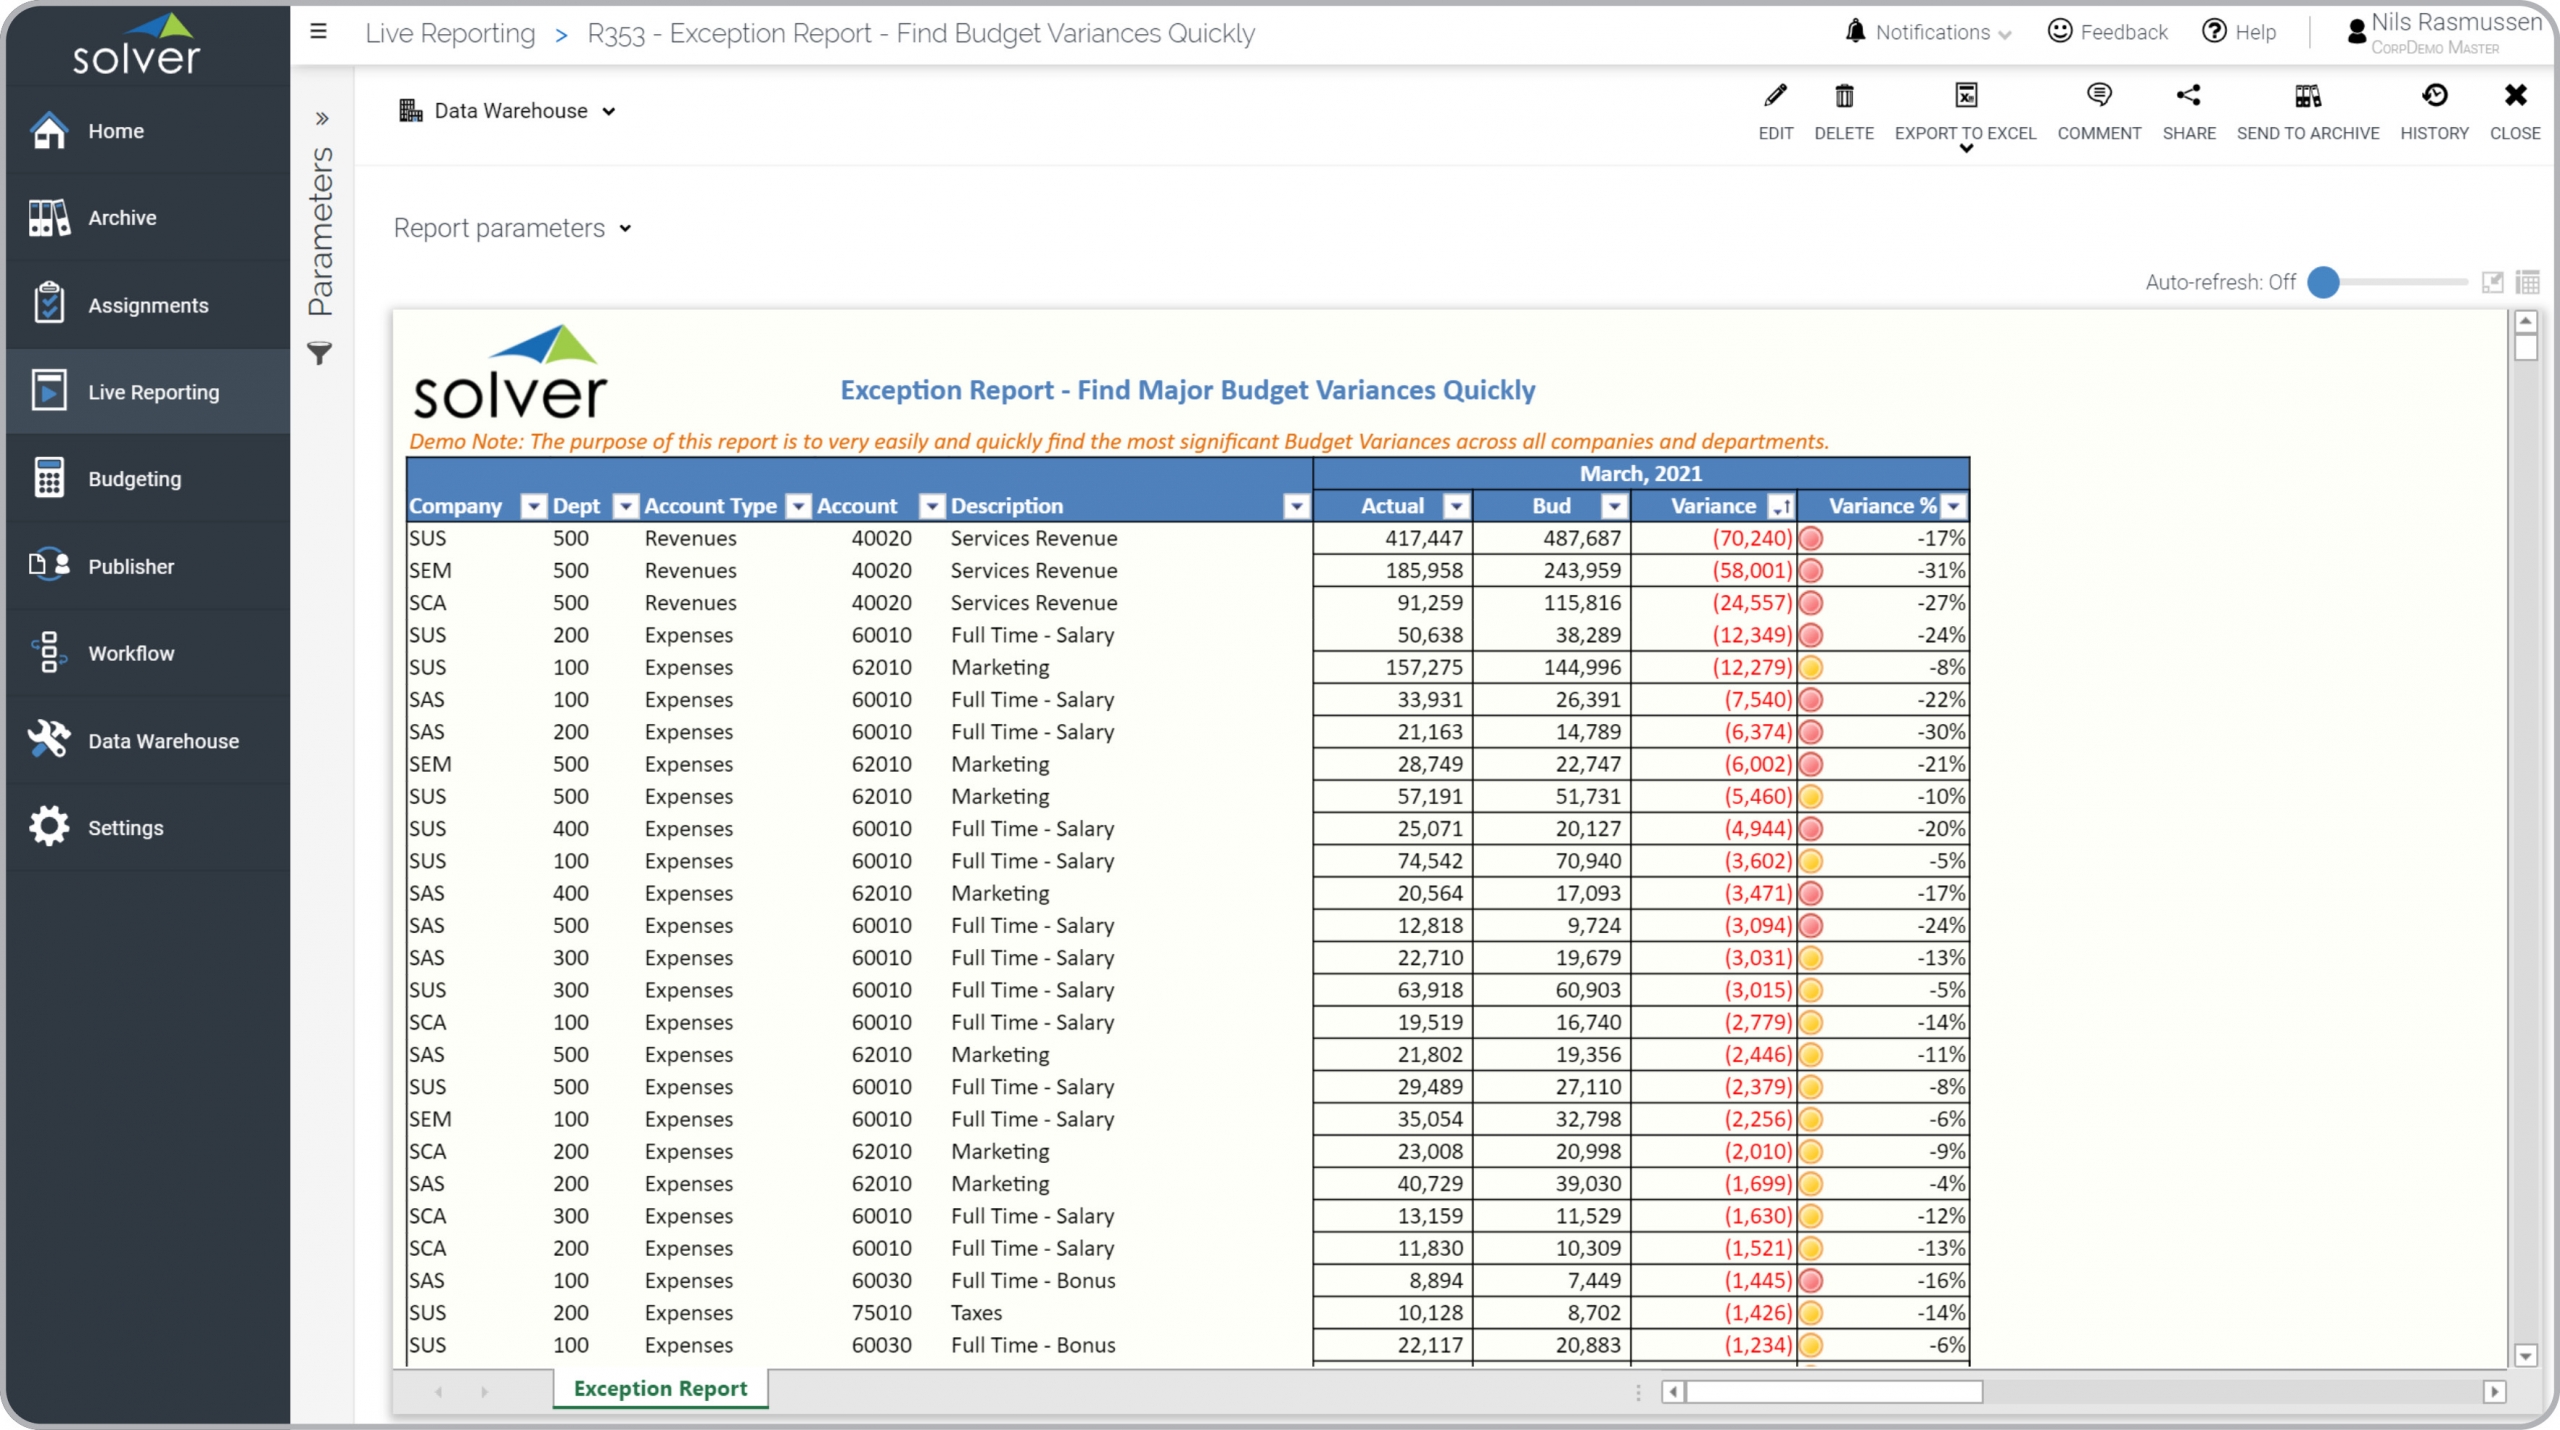
Revenue and Expense Exception Report
? Exception Reports are considered monthly analysis tools and are often used by Controllers and Analysts to quickly and easily find budget variances. Key functionality in this type of report shows all key GL dimensions in the rows with their monthly balance for actual, budget and variance. This allows the user to see across all companies, departments and accounts in one single report. The sort feature on the columns, and the traffic lights highlights key budget variances. You will find an example of this type of report below.
Purpose of
Revenue and Expense Exception Reports Companies and organizations use Revenue and Expense Exception Reports to allow a user to detect significant positive or negative budget variances. When used as part of good business practices in a Finance & Accounting Department, a company can improve its budget variance analysis, as well as, reduce the risk that major budget variances (by amount or percent) go undetected.
Revenue and Expense Exception Report
Example Here is an example of a Revenue and Expense Exception Report to help find budget variances across all accounts and entities in the organization. [caption id="" align="alignnone" width="2560"]
 Revenue and Expense Exception Report Example[/caption] You can find hundreds of additional examples
here.
Who Uses This Type of
Report
? The typical users of this type of report are: Group Controllers and Analysts.
Other
Report
s Often Used in Conjunction with
Revenue and Expense Exception Reports Progressive Finance & Accounting Departments sometimes use several different Revenue and Expense Exception Reports, along with trial balances, financial statements and other management and control tools.
Where Does the Data for Analysis Originate From? The Actual (historical transactions) data typically comes from enterprise resource planning (ERP) systems like: Microsoft Dynamics 365 (D365) Finance, Microsoft Dynamics 365 Business Central (D365 BC), Microsoft Dynamics AX, Microsoft Dynamics NAV, Microsoft Dynamics GP, Microsoft Dynamics SL, Sage Intacct, Sage 100, Sage 300, Sage 500, Sage X3, SAP Business One, SAP ByDesign, Acumatica, Netsuite and others. In analyses where budgets or forecasts are used, the planning data most often originates from in-house Excel spreadsheet models or from professional corporate performance management (CPM/EPM) solutions.
What Tools are Typically used for Reporting, Planning and Dashboards? Examples of business software used with the data and ERPs mentioned above are:
Revenue and Expense Exception Report Example[/caption] You can find hundreds of additional examples
here.
Who Uses This Type of
Report
? The typical users of this type of report are: Group Controllers and Analysts.
Other
Report
s Often Used in Conjunction with
Revenue and Expense Exception Reports Progressive Finance & Accounting Departments sometimes use several different Revenue and Expense Exception Reports, along with trial balances, financial statements and other management and control tools.
Where Does the Data for Analysis Originate From? The Actual (historical transactions) data typically comes from enterprise resource planning (ERP) systems like: Microsoft Dynamics 365 (D365) Finance, Microsoft Dynamics 365 Business Central (D365 BC), Microsoft Dynamics AX, Microsoft Dynamics NAV, Microsoft Dynamics GP, Microsoft Dynamics SL, Sage Intacct, Sage 100, Sage 300, Sage 500, Sage X3, SAP Business One, SAP ByDesign, Acumatica, Netsuite and others. In analyses where budgets or forecasts are used, the planning data most often originates from in-house Excel spreadsheet models or from professional corporate performance management (CPM/EPM) solutions.
What Tools are Typically used for Reporting, Planning and Dashboards? Examples of business software used with the data and ERPs mentioned above are:
- Native ERP report writers and query tools
- Spreadsheets (for example Microsoft Excel)
- Corporate Performance Management (CPM) tools (for example Solver)
- Dashboards (for example Microsoft Power BI and Tableau)
- View 100’s of reporting, consolidations, planning, budgeting, forecasting and dashboard examples here
- Discover how the Solver CPM solution delivers financial and operational reporting
- Discover how the Solver CPM solution delivers planning, budgeting and forecasting
- Watch demo videos of reporting, planning and dashboards
July 29, 2020
TAGS: Reporting, Solver, report writer, Microsoft, consolidation, template, practice, Acumatica, Netsuite, Finance, GP, Business Central, excel, ax, expense, budget variance, budgeting, revenue, Cloud, Software, Tableau, SAP, example, best, Sage, BC, D365, NAV, Intacct, GL, CPM, report, SL, Management, dynamics, Power BI, exception, multi-company, cross-company