

What is a Profit & Loss Variance Report? Profit & Loss Variance Reports are considered a key component in month-end reporting packages and are often used by managers and executives to analyze revenues, expenses and profitability across the business. Some key functionality in this type of report provides monthly and year-to-date variances to both budget and last year's actuals. Key metrics from the report, such as revenue, payroll and profit margin, are also displayed as charts on the top of the report. In the body of the report itself, users can right-click on any figure and drill down to GL or even sub-ledger detail. You will find an example of this type of report below.

Purpose of Profit & Loss Variance Reports Companies and organizations use Profit & Loss Variance Reports to provide their managers with professional and easy-to-read financial analysis. When used as part of good business practices in a Finance & Accounting Department, a company can improve its ability to serve executives and line managers with easy-to-analyze reports, as well as, reduce the chance that important performance metrics are missed or misunderstood by non-financial staff members.
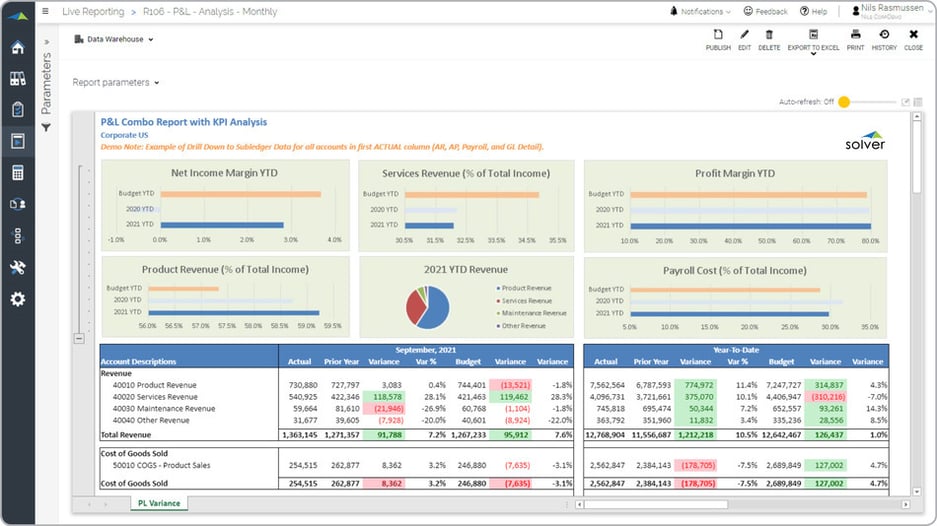
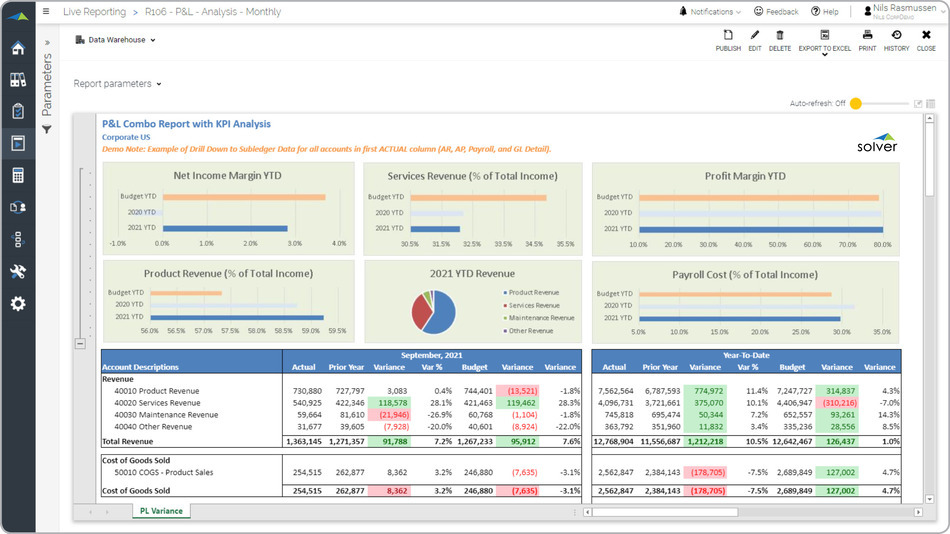
Profit & Loss Variance Report Example Here is an example of a modern Profit & Loss Variance Report with KPIs displayed as charts.
Who Uses This Type of Report? The typical users of this type of report are: Board Members, the Executive Team, Controllers and, in some cases, department heads. Other Reports Often Used in Conjunction with Profit & Loss Variance Reports Progressive Finance & Accounting Departments sometimes use several different Profit & Loss Variance Reports, along with balance sheets, cash flow reports and other management and control tools.
Where Does the Data for Analysis Originate From? The Actual (historical transactions) data typically comes from enterprise resource planning (ERP) systems like: Microsoft Dynamics 365 (D365) Finance, Microsoft Dynamics 365 Business Central (D365 BC), Microsoft Dynamics AX, Microsoft Dynamics NAV, Microsoft Dynamics GP, Microsoft Dynamics SL, Sage Intacct, Sage 100, Sage 300, Sage 500, Sage X3, SAP Business One, SAP ByDesign, Acumatica, Netsuite and others. In analyses where budgets or forecasts are used, the planning data most often originates from in-house Excel spreadsheet models or from professional xFP&A solutions.
What Tools are Typically used for Reporting, Planning and Dashboards? Examples of business software used with the data and ERPs mentioned above are:
To learn more, visit the Resource Library.
Purpose of Profit & Loss Variance Reports Companies and organizations use Profit & Loss Variance Reports to provide their managers with professional and easy-to-read financial analysis. When used as part of good business practices in a Finance & Accounting Department, a company can improve its ability to serve executives and line managers with easy-to-analyze reports, as well as, reduce the chance that important performance metrics are missed or misunderstood by non-financial staff members.
Profit & Loss Variance Report Example Here is an example of a modern Profit & Loss Variance Report with KPIs displayed as charts.
Who Uses This Type of Report? The typical users of this type of report are: Board Members, the Executive Team, Controllers and, in some cases, department heads. Other Reports Often Used in Conjunction with Profit & Loss Variance Reports Progressive Finance & Accounting Departments sometimes use several different Profit & Loss Variance Reports, along with balance sheets, cash flow reports and other management and control tools.
Where Does the Data for Analysis Originate From? The Actual (historical transactions) data typically comes from enterprise resource planning (ERP) systems like: Microsoft Dynamics 365 (D365) Finance, Microsoft Dynamics 365 Business Central (D365 BC), Microsoft Dynamics AX, Microsoft Dynamics NAV, Microsoft Dynamics GP, Microsoft Dynamics SL, Sage Intacct, Sage 100, Sage 300, Sage 500, Sage X3, SAP Business One, SAP ByDesign, Acumatica, Netsuite and others. In analyses where budgets or forecasts are used, the planning data most often originates from in-house Excel spreadsheet models or from professional xFP&A solutions.
What Tools are Typically used for Reporting, Planning and Dashboards? Examples of business software used with the data and ERPs mentioned above are:
- Native ERP report writers and query tools
- Spreadsheets (for example Microsoft Excel)
- extended financial planning and analysis (xFP&A) tools (for example Solver)
- Dashboards (for example Microsoft Power BI and Tableau)
To learn more, visit the Resource Library.
TAGS: Reporting, Consolidation, Budgeting, FP&A, KPIs, ERP, Dashboards, Financial Reporting, Template Library