
What is
a
Multi-company Account Analysis Report
? Multi-company Account Analysis Reports are considered management tools and are used by CFOs and Group Controllers to benchmark account balances across departments and subsidiaries. Some of the key functionality in this type of report lets the user select which accounts to display. The report displays the chosen accounts by department and company with easily expandable rows. Traffic lights and variance columns show current year, last year and month-by-month figures. You will find an example of this type of report below.
Purpose of
Multi-Company Account Analysis Reports Companies and organizations use Multi-Company Account Analysis Reports to easily and quickly view select GL account balances across time and across organizational entities. When used as part of good business practices in a Finance & Accounting Department, a company can improve its financial performance analysis, as well as, reduce the risk that important results are overlooked because of difficulties in comparing it against the rest of the organization.
Multi-Company Account Analysis Report
Example Here is an example of a unique cross-company, cross-department account analysis report. [caption id="" align="alignnone" width="2560"]
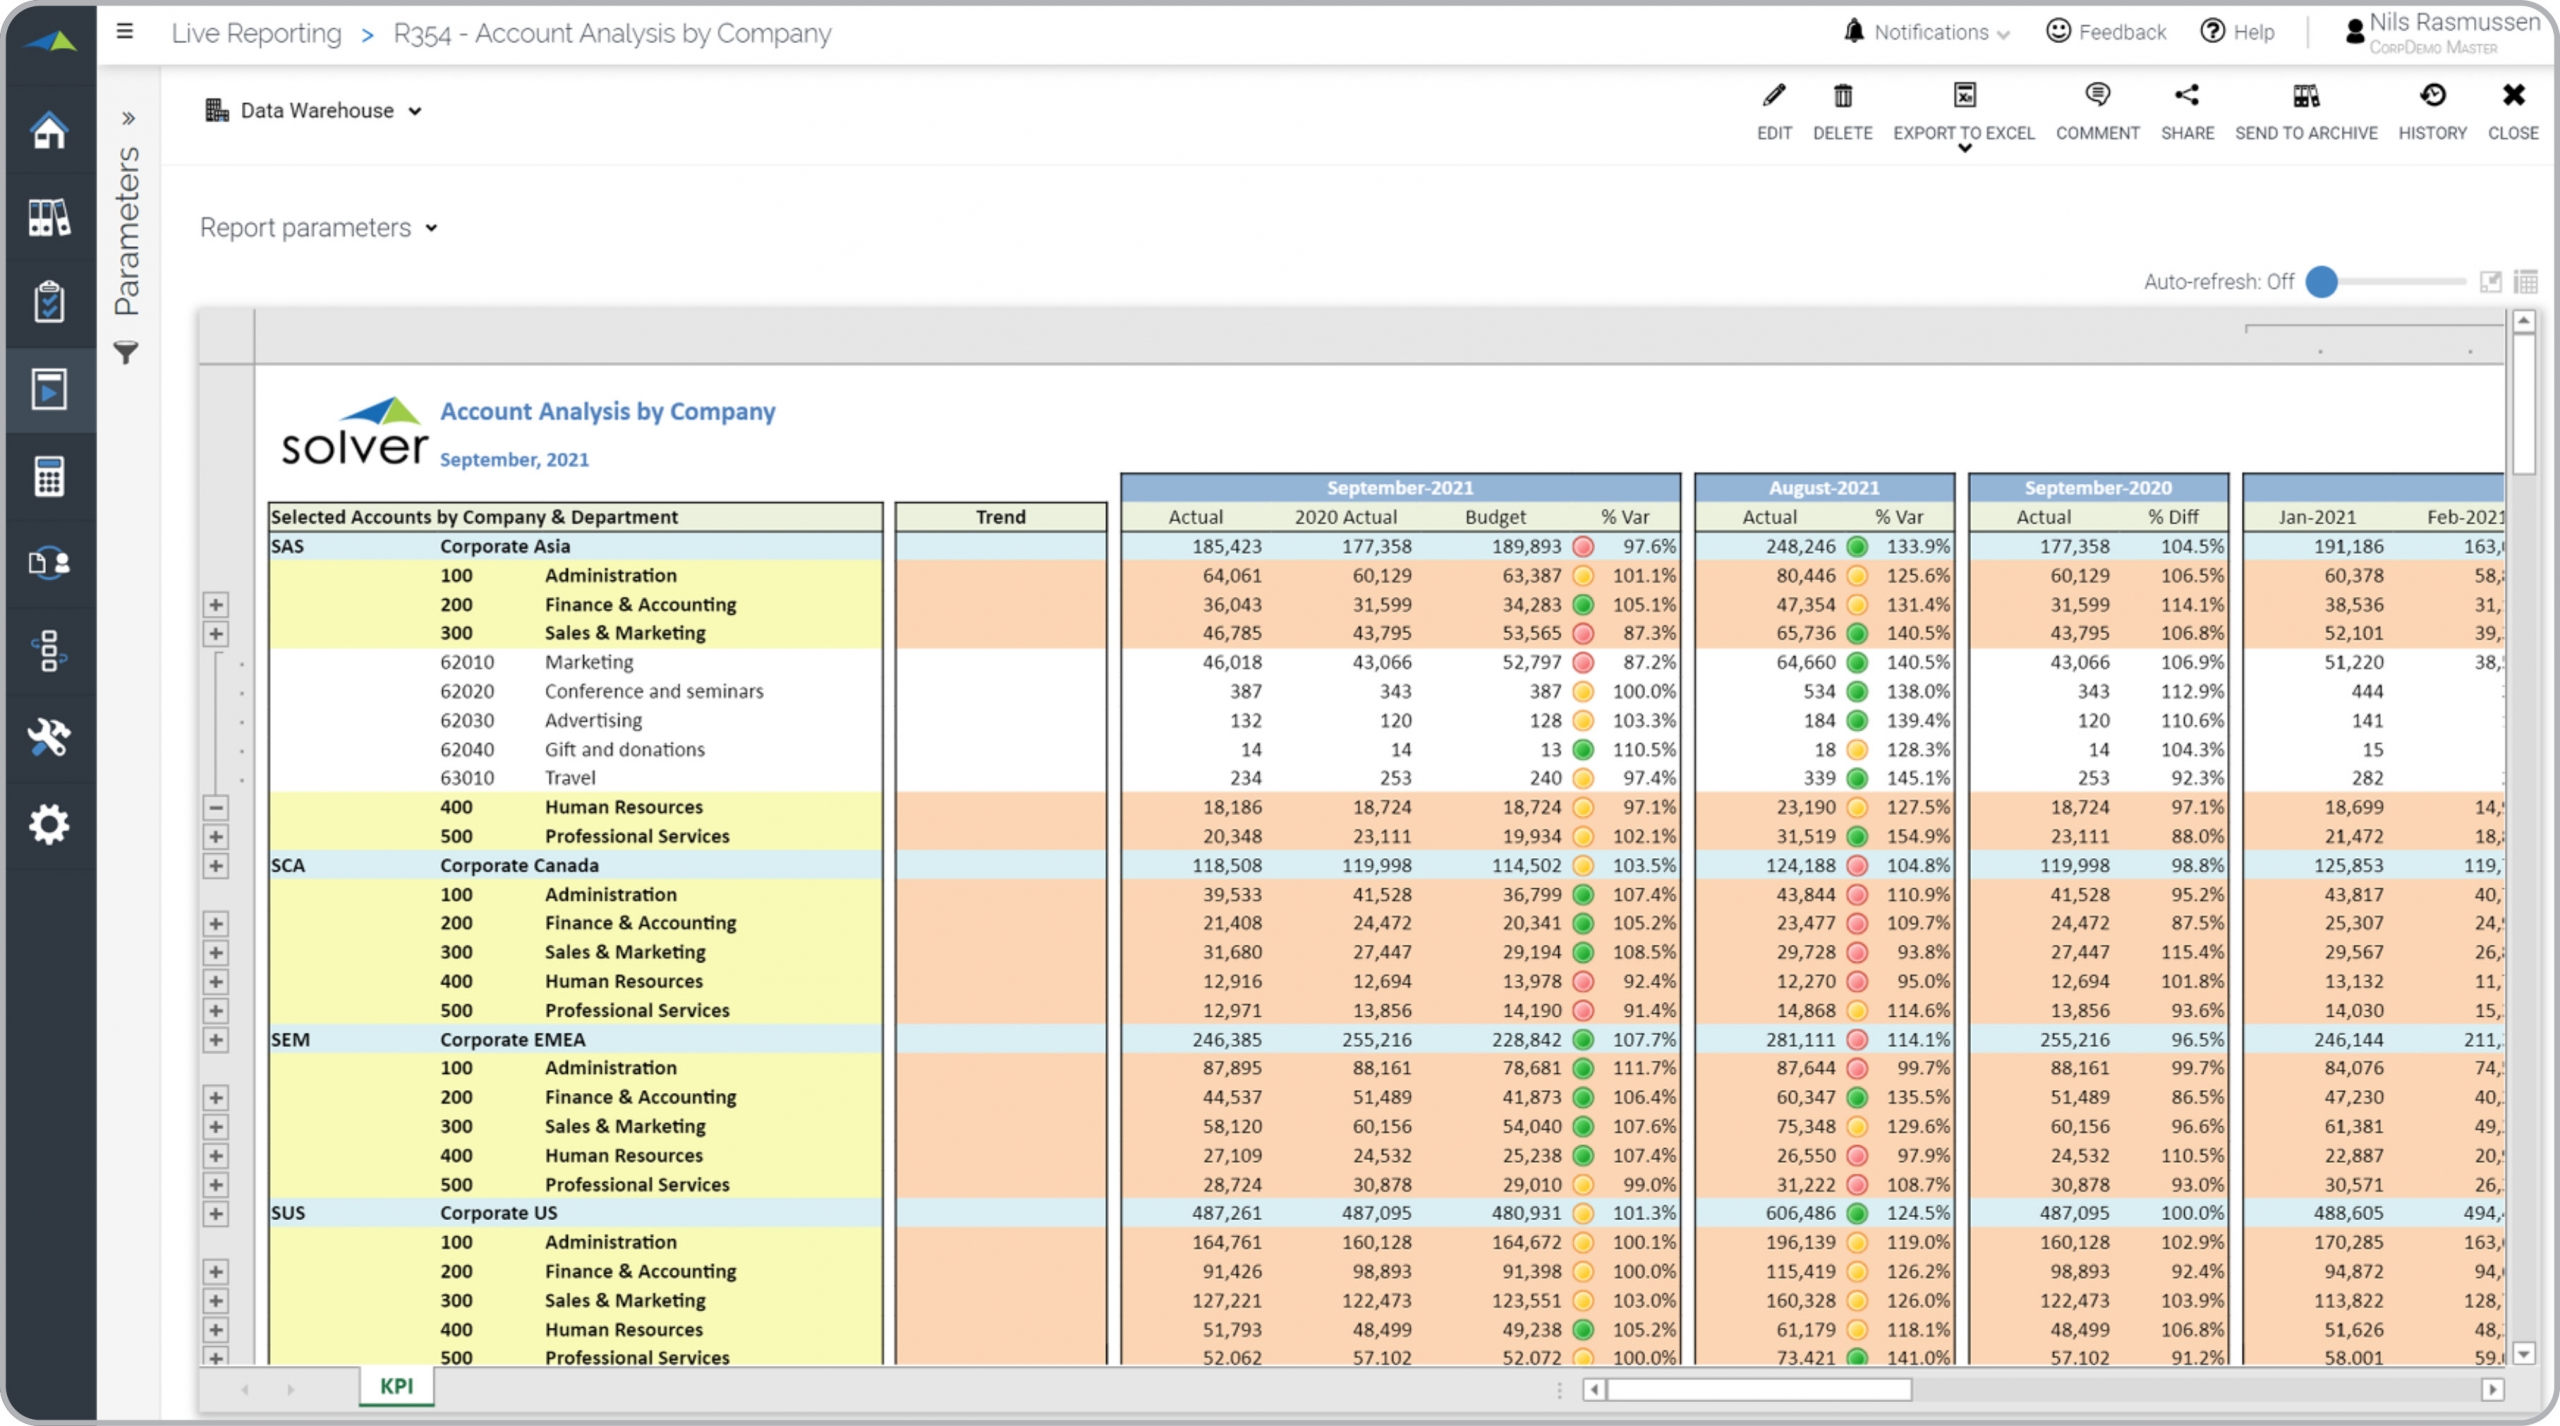 Multi-company Account Analysis Report Example[/caption] You can find hundreds of additional examples
here.
Who Uses This Type of
Report
? The typical users of this type of report are: Executives, CFOs and Controllers.
Other
Report
s Often Used in Conjunction with
Multi-Company Account Analysis Reports Progressive Finance & Accounting Departments sometimes use several different Multi-Company Account Analysis Reports, along with financial statements and other management and control tools.
Where Does the Data for Analysis Originate From? The Actual (historical transactions) data typically comes from enterprise resource planning (ERP) systems like: Microsoft Dynamics 365 (D365) Finance, Microsoft Dynamics 365 Business Central (D365 BC), Microsoft Dynamics AX, Microsoft Dynamics NAV, Microsoft Dynamics GP, Microsoft Dynamics SL, Sage Intacct, Sage 100, Sage 300, Sage 500, Sage X3, SAP Business One, SAP ByDesign, Acumatica, Netsuite and others. In analyses where budgets or forecasts are used, the planning data most often originates from in-house Excel spreadsheet models or from professional corporate performance management (CPM/EPM) solutions.
What Tools are Typically used for Reporting, Planning and Dashboards? Examples of business software used with the data and ERPs mentioned above are:
Multi-company Account Analysis Report Example[/caption] You can find hundreds of additional examples
here.
Who Uses This Type of
Report
? The typical users of this type of report are: Executives, CFOs and Controllers.
Other
Report
s Often Used in Conjunction with
Multi-Company Account Analysis Reports Progressive Finance & Accounting Departments sometimes use several different Multi-Company Account Analysis Reports, along with financial statements and other management and control tools.
Where Does the Data for Analysis Originate From? The Actual (historical transactions) data typically comes from enterprise resource planning (ERP) systems like: Microsoft Dynamics 365 (D365) Finance, Microsoft Dynamics 365 Business Central (D365 BC), Microsoft Dynamics AX, Microsoft Dynamics NAV, Microsoft Dynamics GP, Microsoft Dynamics SL, Sage Intacct, Sage 100, Sage 300, Sage 500, Sage X3, SAP Business One, SAP ByDesign, Acumatica, Netsuite and others. In analyses where budgets or forecasts are used, the planning data most often originates from in-house Excel spreadsheet models or from professional corporate performance management (CPM/EPM) solutions.
What Tools are Typically used for Reporting, Planning and Dashboards? Examples of business software used with the data and ERPs mentioned above are:
- Native ERP report writers and query tools
- Spreadsheets (for example Microsoft Excel)
- Corporate Performance Management (CPM) tools (for example Solver)
- Dashboards (for example Microsoft Power BI and Tableau)
- View 100’s of reporting, consolidations, planning, budgeting, forecasting and dashboard examples here
- Discover how the Solver CPM solution delivers financial and operational reporting
- Discover how the Solver CPM solution delivers planning, budgeting and forecasting
- Watch demo videos of reporting, planning and dashboards
July 24, 2020
TAGS: Reporting, Solver, report writer, Microsoft, consolidation, template, practice, Acumatica, Netsuite, Finance, GP, consolidating, Business Central, excel, ax, budgeting, Cloud, Software, Tableau, SAP, example, best, Sage, BC, D365, NAV, Intacct, Variance, CPM, report, SL, Management, dynamics, Power BI, analysis report, multi-company