
What is a Trended Monthly Cash Flow Statement
? Trended Cash Flow Statements are considered financial reporting tools and are used by CFOs and Controllers to monitor sources and uses of cash and net cash flow. Some of the main functionality in this type of report is that it is parameter driven and automatically displays months up to the current period across the columns. The rows of the report shows a typical layout of a financial statement. You find an example of this type of report below.
Purpose of
Trended Cash Flow Reports Hospitality companies use Trended Cash Flow Reports to analyze trends in sources and uses of cash. When used as part of good business practices in FP&A departments, a company can improve its liquidity and strategic investment options, and it can reduce the chances that unexpected cash flow trends leads to surprises.
Example of a
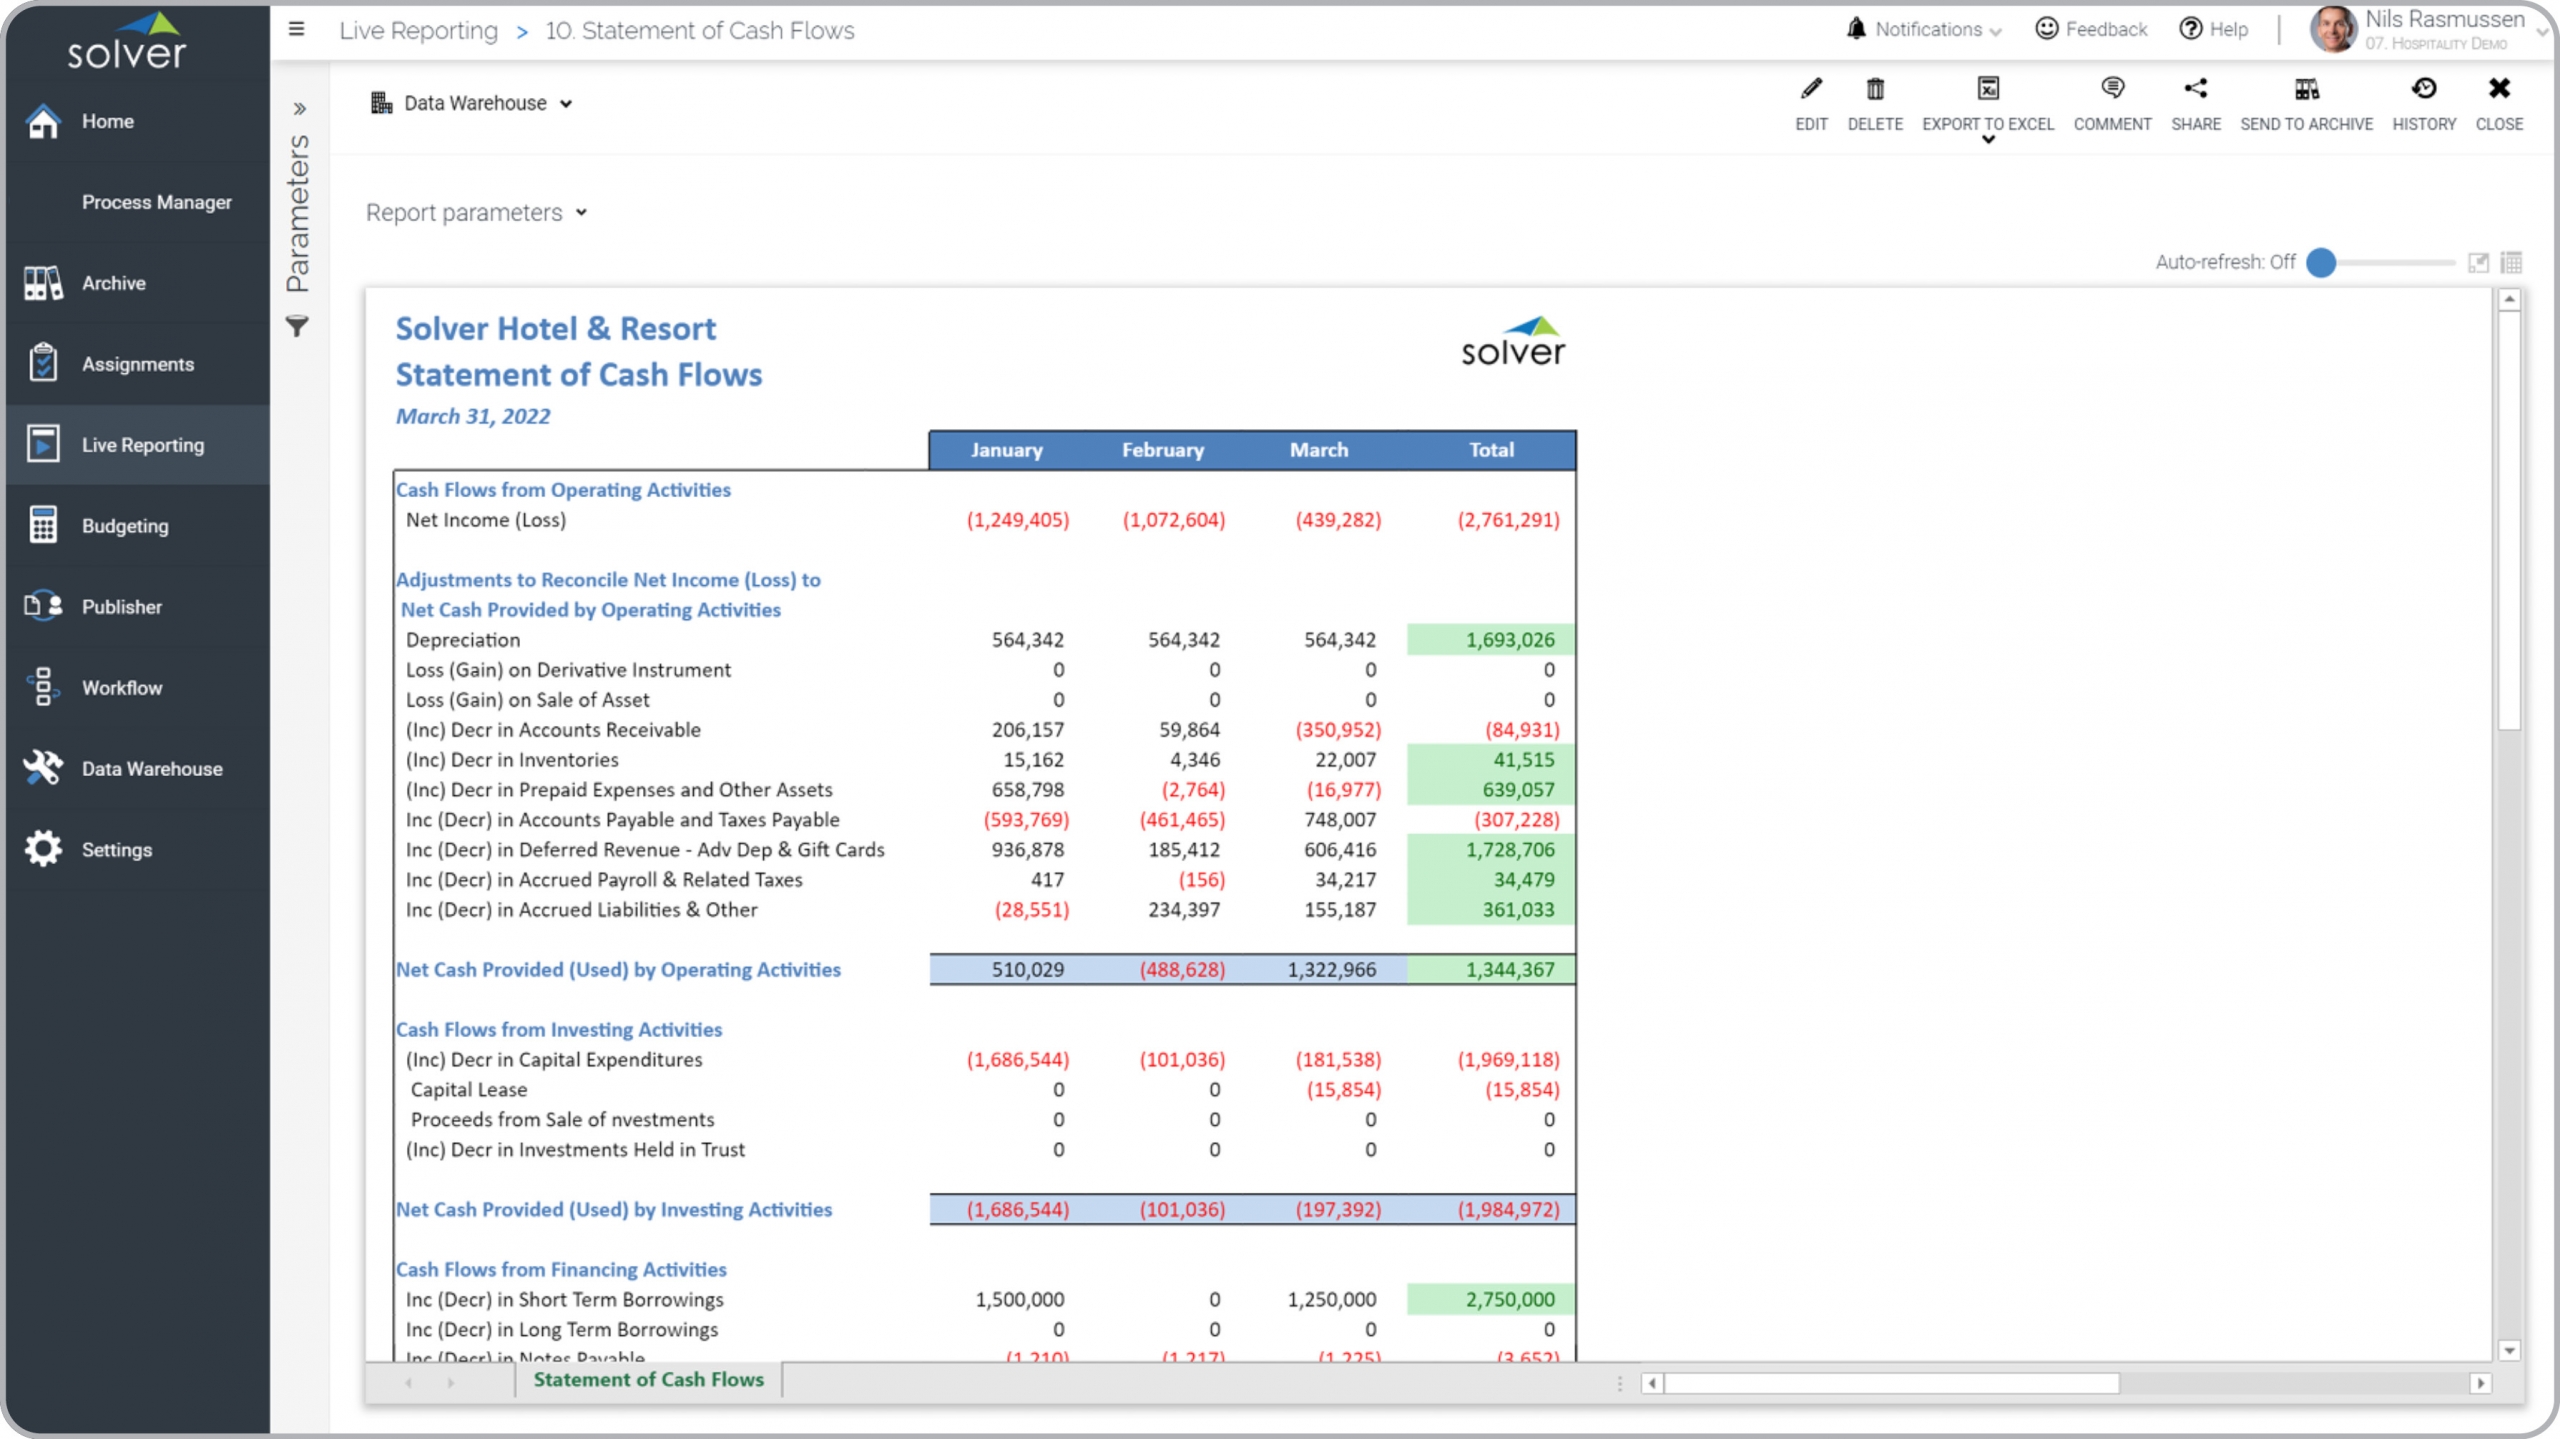
Trended Cash Flow Report Here is an example of a Trended Cash Flow Statement with exception highlighting. [caption id="" align="alignnone" width="2560"]
 Example of a Monthly Cash Flow Statement for hospitality companies[/caption] You can find hundreds of additional examples
here
Who Uses This Type of
Report
? The typical users of this type of report are: CFOs, executives, analysts, budget managers.
Other Reports Often Used in Conjunction with
Trended Cash Flow Reports Progressive FP&A departments sometimes use several different Trended Cash Flow Reports, along with profit & loss reports, balance sheets, KPI reports, dashboards, cash flow forecasts and other management and control tools.
Where Does the Data for Analysis Originate From? The Actual (historical transactions) data typically comes from enterprise resource planning (ERP) systems like: Microsoft Dynamics 365 (D365) Finance, Microsoft Dynamics 365 Business Central (D365 BC), Microsoft Dynamics AX, Microsoft Dynamics NAV, Microsoft Dynamics GP, Microsoft Dynamics SL, Sage Intacct, Sage 100, Sage 300, Sage 500, Sage X3, SAP Business One, SAP ByDesign, Acumatica, Netsuite and others. In analyses where budgets or forecasts are used, the planning data most often originates from in-house Excel spreadsheet models or from professional corporate performance management (CPM/EPM) solutions.
What Tools are Typically used for Reporting, Planning and Dashboards? Examples of business software used with the data and ERPs mentioned above are:
Example of a Monthly Cash Flow Statement for hospitality companies[/caption] You can find hundreds of additional examples
here
Who Uses This Type of
Report
? The typical users of this type of report are: CFOs, executives, analysts, budget managers.
Other Reports Often Used in Conjunction with
Trended Cash Flow Reports Progressive FP&A departments sometimes use several different Trended Cash Flow Reports, along with profit & loss reports, balance sheets, KPI reports, dashboards, cash flow forecasts and other management and control tools.
Where Does the Data for Analysis Originate From? The Actual (historical transactions) data typically comes from enterprise resource planning (ERP) systems like: Microsoft Dynamics 365 (D365) Finance, Microsoft Dynamics 365 Business Central (D365 BC), Microsoft Dynamics AX, Microsoft Dynamics NAV, Microsoft Dynamics GP, Microsoft Dynamics SL, Sage Intacct, Sage 100, Sage 300, Sage 500, Sage X3, SAP Business One, SAP ByDesign, Acumatica, Netsuite and others. In analyses where budgets or forecasts are used, the planning data most often originates from in-house Excel spreadsheet models or from professional corporate performance management (CPM/EPM) solutions.
What Tools are Typically used for Reporting, Planning and Dashboards? Examples of business software used with the data and ERPs mentioned above are:
- Native ERP report writers and query tools
- Spreadsheets (for example Microsoft Excel)
- Corporate Performance Management (CPM) tools (for example Solver)
- Dashboards (for example Microsoft Power BI and Tableau)
- View 100’s of reporting, consolidations, planning, budgeting, forecasting and dashboard examples here
- View a Hospitality industry white paper and other industry-specific information here
- See how reports are designed in a modern report writer using a cloud-connected Excel add-in writer
- Discover how the Solver CPM solution delivers financial and operational reporting
- Discover how the Solver CPM solution delivers planning, budgeting and forecasting
- Watch demo videos of reporting, planning and dashboards
August 13, 2021
TAGS: Reporting, Solver, report writer, Microsoft, golf, template, practice, Acumatica, hospitality, Netsuite, Finance, planning, GP, Business Central, excel, restaurant, resort, spa, ax, hotel, forecast, Budget, Dynamics 365, analysis, budgeting, Cloud, Software, casino, Tableau, SAP, example, best, Sage, BC, D365, NAV, Intacct, CPM, report, SL, Management, dynamics, Power BI, cash flow report, cash flow, cash flow statement