
Balance Sheet – Monthly
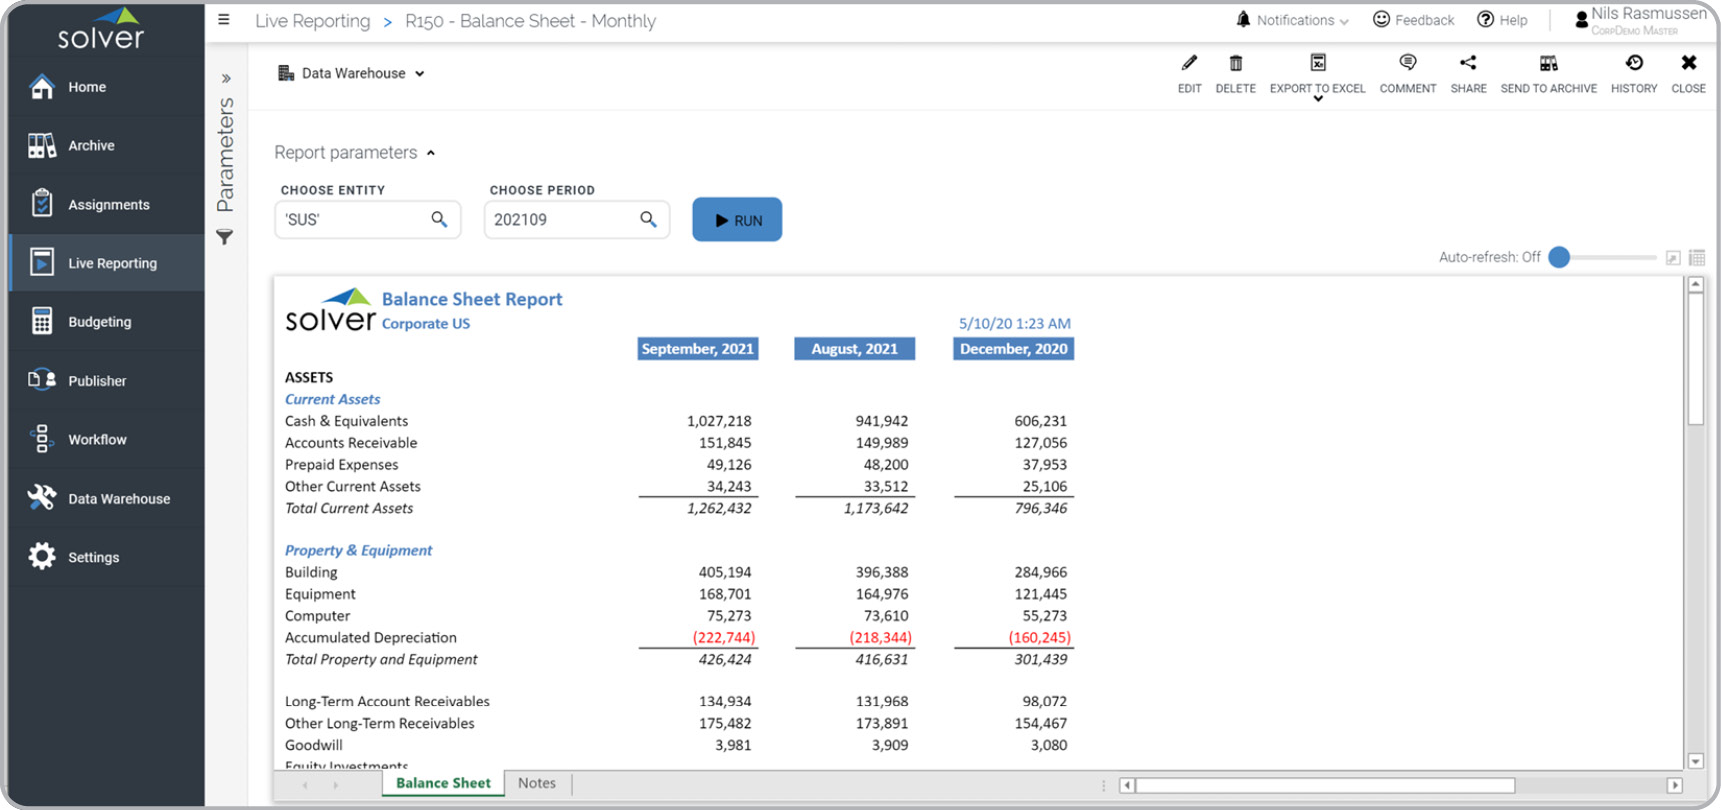
What is a Monthly Balance Sheet with Prior Month and Last Year Comparisons? Monthly Balance Sheet reports are considered essential month-end financial statements and are used by CFOs and accountants to review key elements of the company's assets and liabilities. Some functionality in this type of report is parameter driven and will populate the data and headers in three columns. You will find an example of this type of report below.
Purpose of Monthly Balance Sheets Companies and organizations use Monthly Balance Sheets to easily track month-over-month performance of assets and liabilities. When used as part of good business practices in a Finance and Accounting Department, a company can improve its monthly reporting automation and fiscal control as well as reduce the chances that important changes goes undetected.
Who Uses This Type of Report? The typical users of this type of report are: CFOs, Controllers and Accountants. Other Reports Often Used in Conjunction with Monthly Balance Sheets Progressive Finance and Accounting Departments sometimes use several different Monthly Balance Sheets, along with monthly profit & loss, cash flow statements and other management and control tools.
Where Does the Data for Analysis Originate From? The Actual (historical transactions) data typically comes from enterprise resource planning (ERP) systems like: Microsoft Dynamics 365 (D365) Finance, Microsoft Dynamics 365 Business Central (D365 BC), Microsoft Dynamics AX, Microsoft Dynamics NAV, Microsoft Dynamics GP, Microsoft Dynamics SL, Sage Intacct, Sage 100, Sage 300, Sage 500, Sage X3, SAP Business One, SAP ByDesign, Acumatica, Netsuite and others. In analyses where budgets or forecasts are used, the planning data most often originates from in-house Excel spreadsheet models or from professional xFP&A solutions.
This Solver report template connects directly to your ERP data via the Solver Data Warehouse, enabling near real-time analysis with minimal setup. Designed for QuickStart deployment, it can be activated rapidly so your team can focus on analysis and decisions — not data preparation.
What is the Balance Sheet – Monthly in Solver? The Balance Sheet – Monthly is a pre-built xFP&A report template in Solver that delivers key financial and operational metrics in a single, easy-to-use interface, eliminating the need for manual data work or custom report development.
Who uses this Solver report template? Cfos, fp&a managers, and controllers rely on this Solver report template for consistent, parameter-driven reporting that can be run on demand or on a scheduled basis. It eliminates the manual work typically required to produce this type of analysis.
Where does the data come from? Data is sourced automatically from your ERP system through the Solver Data Warehouse, which integrates with platforms such as Microsoft Dynamics 365 Business Central, Dynamics 365 Finance, Acumatica, Sage Intacct, and other leading ERP solutions. Once connected, the template updates in near real-time with no manual data entry required.
To learn more, visit the Resource Library.