
What is
a
Marketing Budget Simulation Dashboard
? Marketing Simulation Dashboards are considered planning and scenario analysis tools and are used by marketing and sales managers to determine the required campaign budget to satisfy the sales team's lead funnel targets before and after final approval. Some of the main functionality in this type of simulation dashboard is that it starts with the target sales budget figure and guides the user through a simple set of drivers to arrive the marketing budget needed to support the sales target. The sliders seen on the left of the dashboards are "what-if" drivers the user can adjust. They include: Target deal size, Target win rate, Target lead conversion, Target number of leads per campaign, and Target cost per campaign. As the user adjusts each slider, all the related charts and figures automatically update. On the far right, the dashboard displays the resulting required campaign budget, and the user can click the "Open budget form" button to enter the detailed marketing budget. You find an example of this type of simulation dashboard below.
Purpose of
Marketing Budget Simulation Dashboards Companies use Marketing Budget Simulation Dashboards to make it very easy and logical for marketing executives to take a sales budget goal and break it back into a connected marketing budget. When used as part of good business practices in a Financial Planning & Analysis (FP&A) and Marketing department, an organization can improve its marketing budget accuracy, and it can reduce the chances of budget misses because the marketing department didn't get the funding required to support the sales team's revenue target.
Marketing Budget Simulation Dashboard
Example Here is an example of a Marketing Budget Simulation Dashboard with interactive sliders for what-if and scenario analysis to arrive at a target marketing budget. [caption id="" align="alignnone" width="2175"]
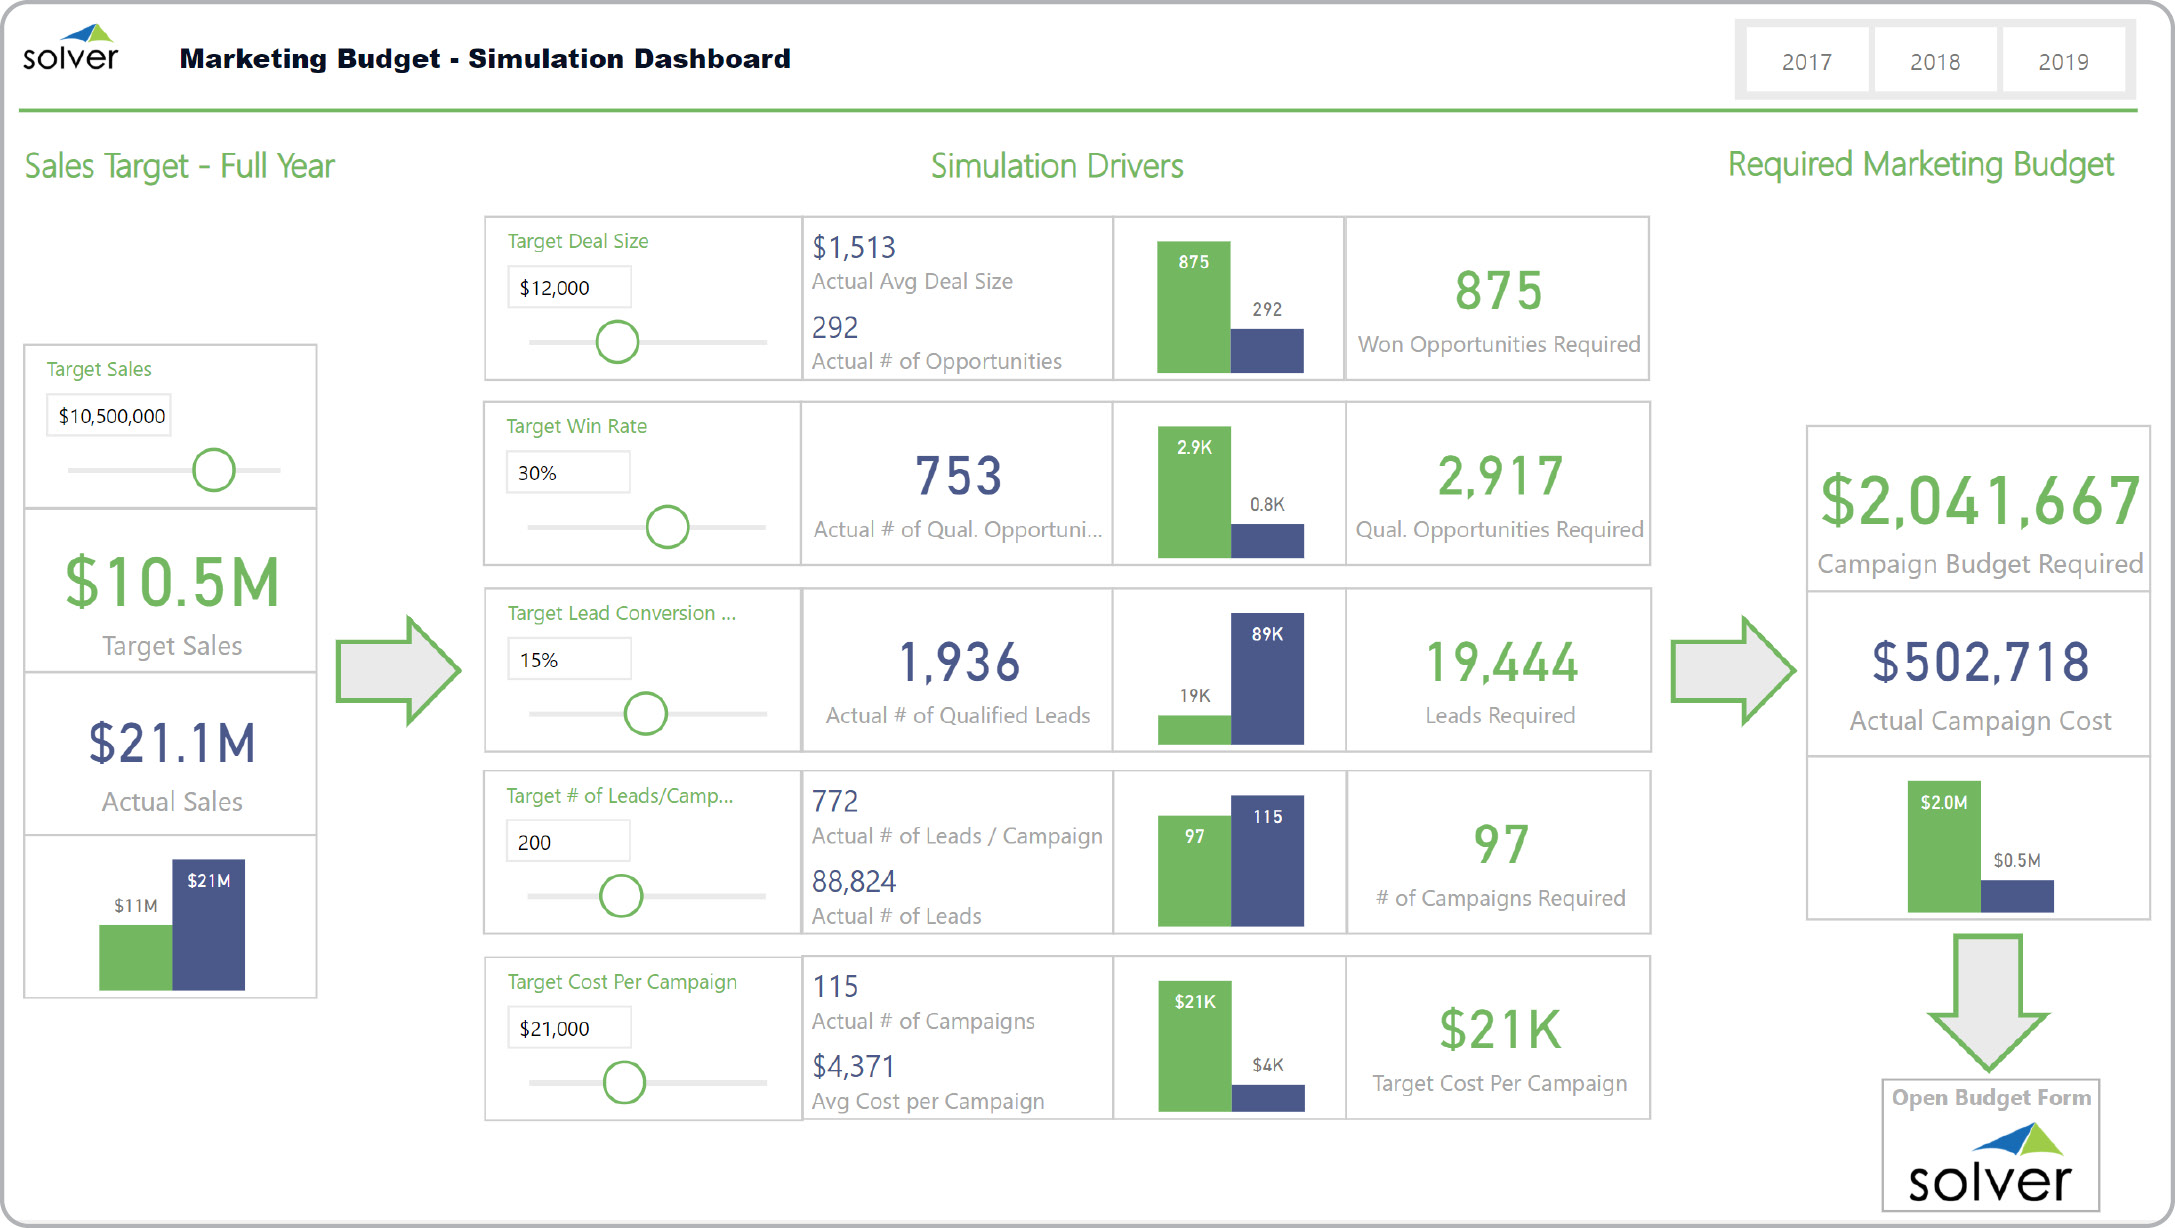 Marketing Budget Simulation Dashboard Example[/caption] You can find hundreds of additional examples
here
Who Uses This Type of
Simulation Dashboard
? The typical users of this type of simulation dashboard are: Marketing executives, sales managers, budget managers.
Other
Dashboard
s and Reports Often Used in Conjunction with
Marketing Budget Simulation Dashboards Progressive Financial Planning & Analysis (FP&A) and Marketing departments sometimes use several different Marketing Budget Simulation Dashboards, along with marketing budget input models, sales dashboards, sales reports, campaign ROI reports, CRM pipeline reports, budget summary dashboards, financial statements with trended budget figures and other management and control tools.
Where Does the Data for Analysis Originate From? The Actual (historical transactions) data typically comes from enterprise resource planning (ERP) systems like: Microsoft Dynamics 365 (D365) Finance, Microsoft Dynamics 365 Business Central (D365 BC), Microsoft Dynamics AX, Microsoft Dynamics NAV, Microsoft Dynamics GP, Microsoft Dynamics SL, Sage Intacct, Sage 100, Sage 300, Sage 500, Sage X3, SAP Business One, SAP ByDesign, Acumatica, Netsuite and others. In analyses where budgets or forecasts are used, the planning data most often originates from in-house Excel spreadsheet models or from corporate performance management (CPM/EPM) solutions. Lead, campaign and pipeline data usually originates from a CRM system like Salesforce or Microsoft Dynamics 365 Customer Experience (D365 CE).
What Tools are Typically used for Reporting, Planning and Dashboards? Examples of business software used with the data and ERPs mentioned above are:
Marketing Budget Simulation Dashboard Example[/caption] You can find hundreds of additional examples
here
Who Uses This Type of
Simulation Dashboard
? The typical users of this type of simulation dashboard are: Marketing executives, sales managers, budget managers.
Other
Dashboard
s and Reports Often Used in Conjunction with
Marketing Budget Simulation Dashboards Progressive Financial Planning & Analysis (FP&A) and Marketing departments sometimes use several different Marketing Budget Simulation Dashboards, along with marketing budget input models, sales dashboards, sales reports, campaign ROI reports, CRM pipeline reports, budget summary dashboards, financial statements with trended budget figures and other management and control tools.
Where Does the Data for Analysis Originate From? The Actual (historical transactions) data typically comes from enterprise resource planning (ERP) systems like: Microsoft Dynamics 365 (D365) Finance, Microsoft Dynamics 365 Business Central (D365 BC), Microsoft Dynamics AX, Microsoft Dynamics NAV, Microsoft Dynamics GP, Microsoft Dynamics SL, Sage Intacct, Sage 100, Sage 300, Sage 500, Sage X3, SAP Business One, SAP ByDesign, Acumatica, Netsuite and others. In analyses where budgets or forecasts are used, the planning data most often originates from in-house Excel spreadsheet models or from corporate performance management (CPM/EPM) solutions. Lead, campaign and pipeline data usually originates from a CRM system like Salesforce or Microsoft Dynamics 365 Customer Experience (D365 CE).
What Tools are Typically used for Reporting, Planning and Dashboards? Examples of business software used with the data and ERPs mentioned above are:
- Native ERP report writers and query tools
- Spreadsheets (for example Microsoft Excel)
- Corporate Performance Management (CPM) tools (for example Solver)
- Dashboards (for example Microsoft Power BI and Tableau)
- View 100’s of reporting, consolidations, planning, budgeting, forecasting and dashboard examples here
- See how reports are designed in a modern report writer using a cloud-connected Excel add-in writer
- Discover how the Solver CPM solution delivers financial and operational reporting
- Discover how the Solver CPM solution delivers planning, budgeting and forecasting
- Watch demo videos of reporting, planning and dashboards
February 22, 2021
TAGS: Reporting, Solver, report writer, Microsoft, campaign, campaign cost, marketing cost, template, scenario, practice, Acumatica, visualization, Netsuite, Finance, planning, GP, dashboard, D365 CE, graphical, Business Central, excel, Dynamics 365 CRM, ax, Salesforce, forecast, Budget, Dynamics 365, budgeting, modelling, Dynamics 365 Customer Experience, simulation, Cloud, Software, Microsoft CRM, marketing, Tableau, SAP, example, best, Sage, BC, D365, NAV, Intacct, CRM, CPM, report, funnel, SL, Management, dynamics, Power BI