

Tech – Help Desk Service Goals
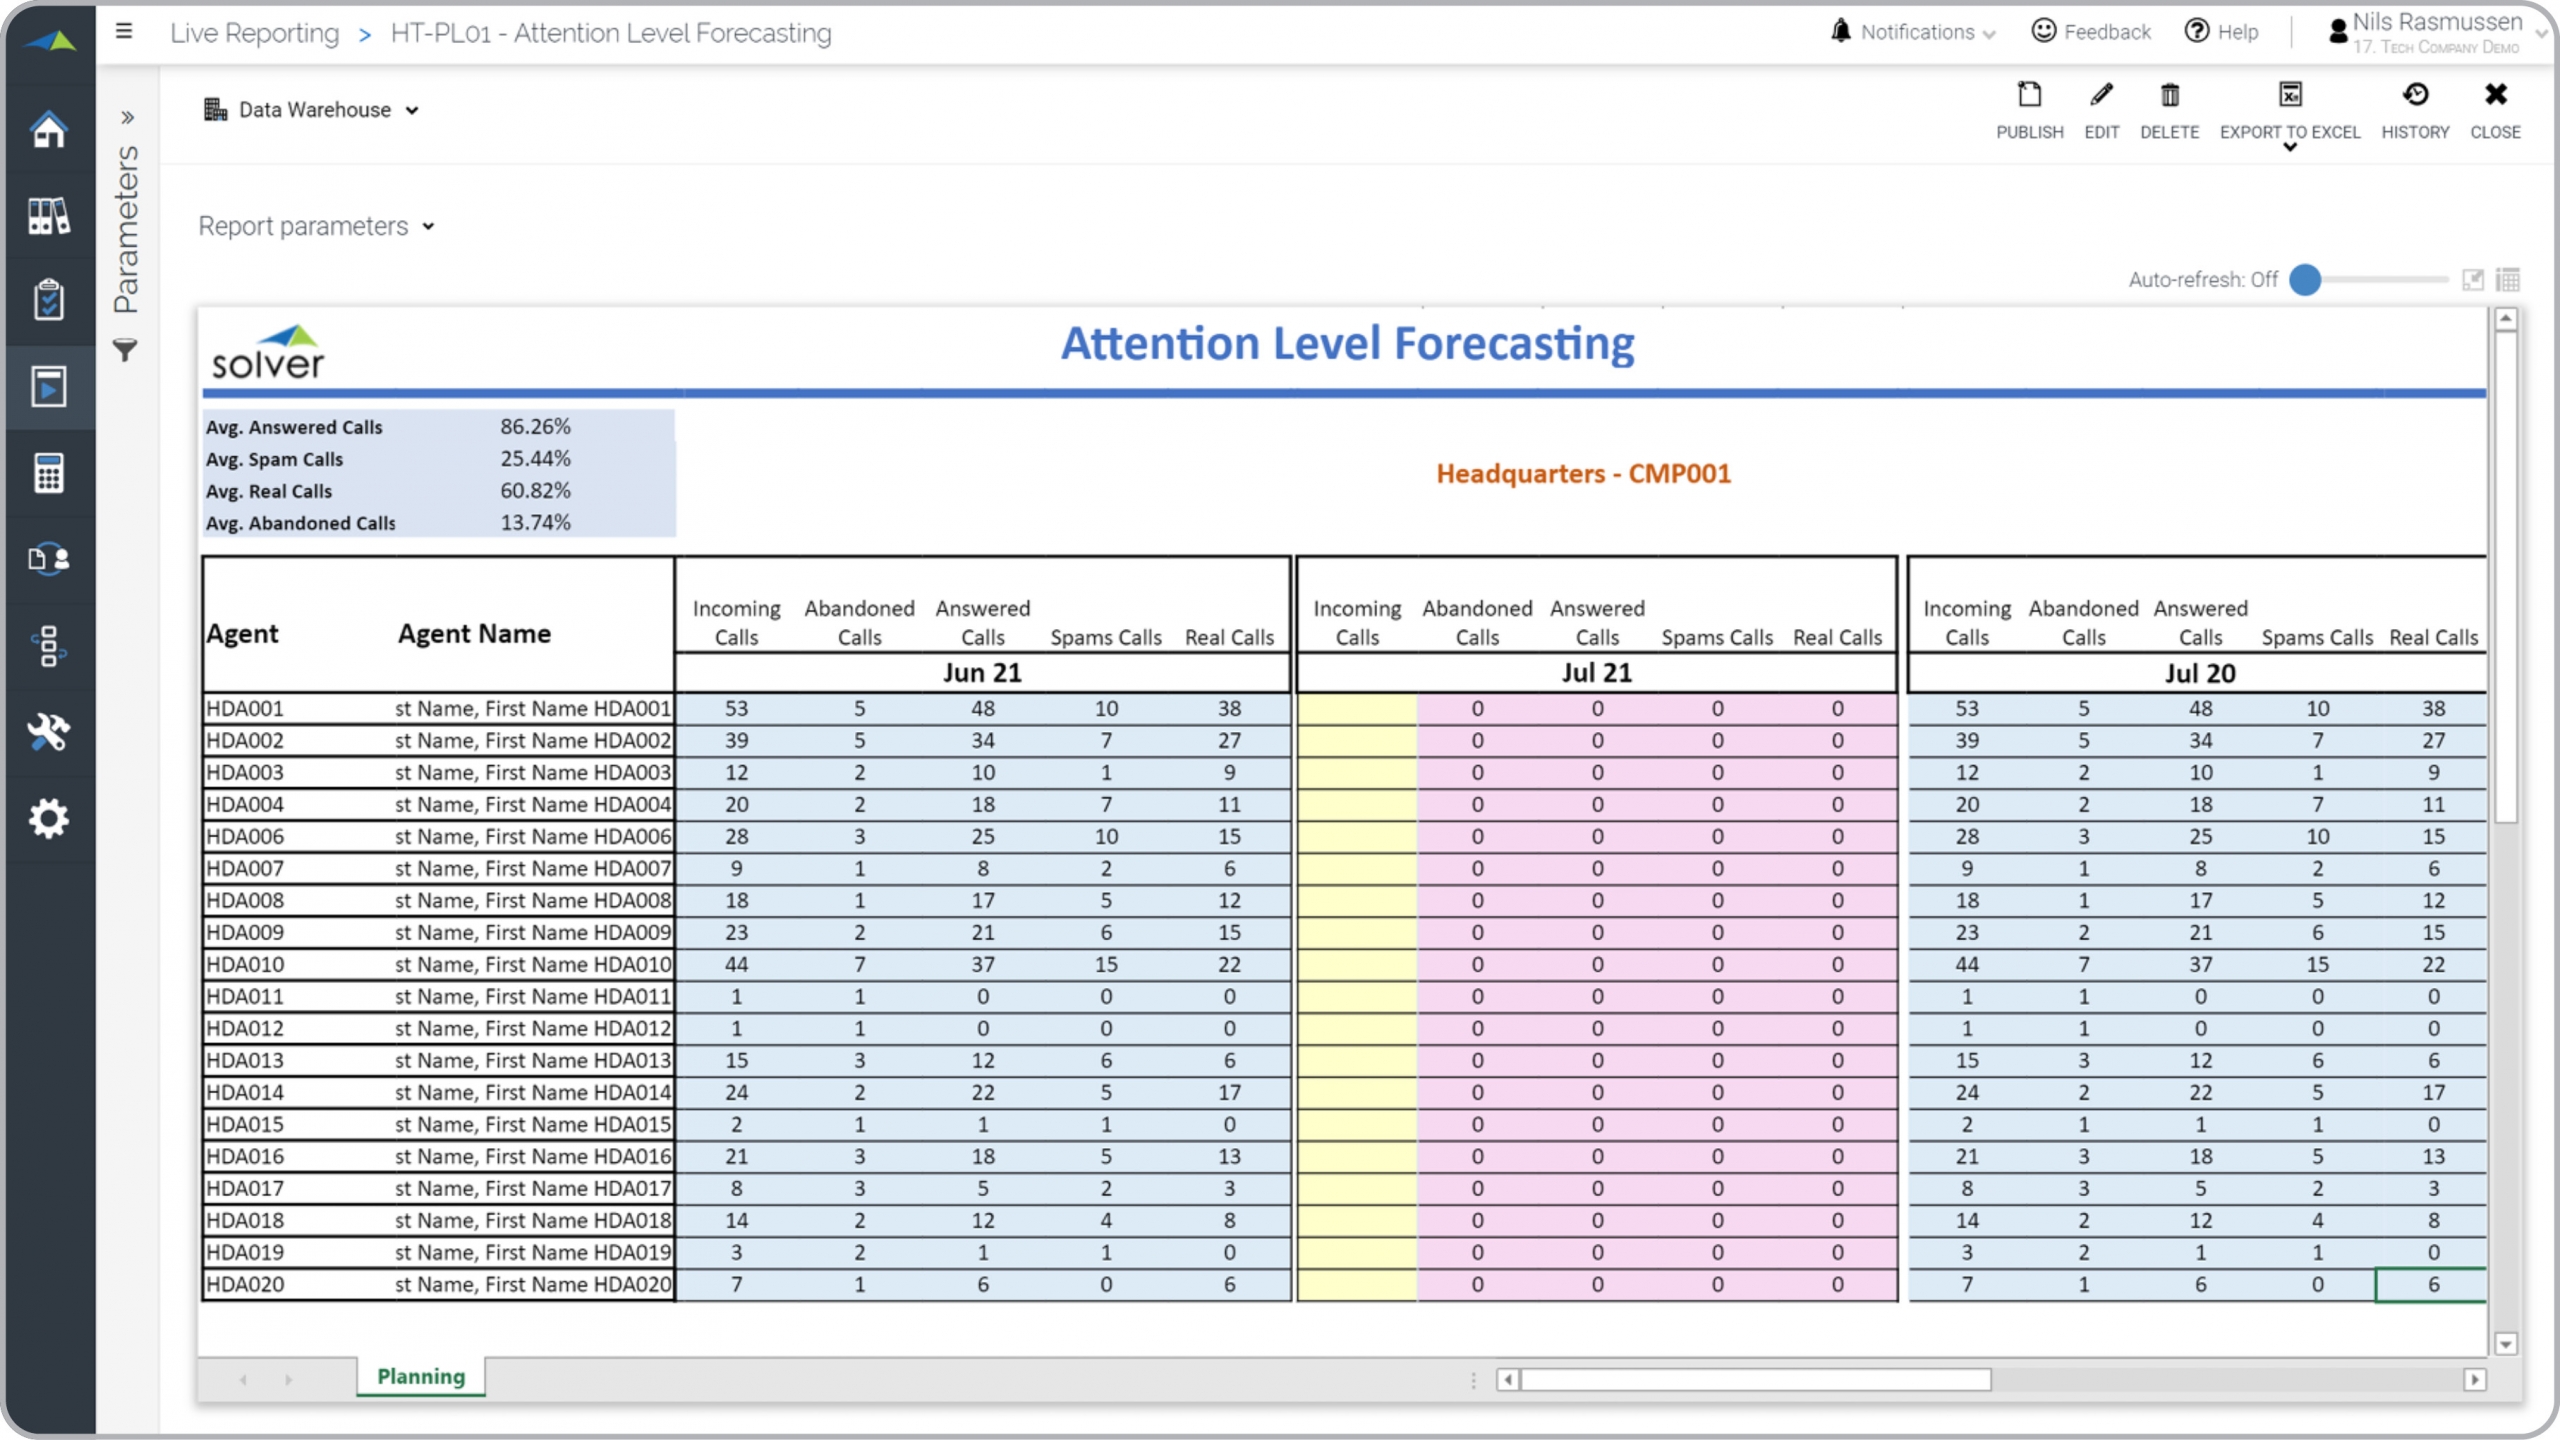
What is a Helpdesk Service Goals and Call Volume Forecast? Hepdesk Service and Call Volume forecasts are considered planning tools and are often used by helpdesk/support managers to review past productivity per helpdesk agent and use it to forecast future call metrics. Some of the key functionality in this type of planning template is that it provides historical call metrics by support person, both for the prior month and the same month last year. Then the total call volume forecast for next month is entered in the yellow column seen in the example below. Using the drivers entered on the top left side, the model then automatically calculates Abandoned calls, Answered Calls, Spam Calls and Real Calls.. You find an example of this type of planning template below.
Purpose of Helpdesk Service Goals and Call Volume Forecast models Companies use Helpdesk Service Goals and Call Volume Forecast models to create individual productivity forecasts by support team member. When used as part of good business practices in a Helpdesk department, a company can improve its planning accuracy and enable better staffing strategies as well as reduce the chances that poor individual performance goes undected and that this lowers productivity forecasts without proper analysis.
Who Uses This Type of Planning template? The typical users of this type of planning template are: Helpdesk Managers, Budget Managers. Other Planning templates Often Used in Conjunction with Helpdesk Service Goals and Call Volume Forecast models Progressive Helpdesk Departments sometimes use several different Helpdesk Service Goals and Call Volume Forecast models, along with helpdesk dashboards, support ticket reports, expense and revenue budgets/forecasts and other management and control tools.
Where Does the Data for Analysis Originate From? The Actual (historical transactions) data typically comes from enterprise resource planning (ERP) systems like: Microsoft Dynamics 365 (D365) Finance, Microsoft Dynamics 365 Business Central (D365 BC), Microsoft Dynamics AX, Microsoft Dynamics NAV, Microsoft Dynamics GP, Microsoft Dynamics SL, Sage Intacct, Sage 100, Sage 300, Sage 500, Sage X3, SAP Business One, SAP ByDesign, Acumatica, Netsuite and others. In analyses where budgets or forecasts are used, the planning data most often originates from in-house Excel spreadsheet models or from professional xFP&A solutions.
To learn more, visit the Resource Library.