
What is
a
Drug Project Cost Budget
? Drug Project Cost Budgets are considered financial planning tools and are used by R&D department heads and budget managers to allocate expected R&D and overhead expenses to each drug under development. Some of the main functionality in this type of forecast and budget model is that it shows the actual figures from the prior period and provides input (yellow cells in the image below) for the common year. Each drug under development is listed down the rows and there is a grand total at the bottom. The user can run the form for any budget or forecast version. You find an example of this type of planning model below.
Purpose of
Drug Development Cost Budgets Pharmaceutical companies use Drug Development Cost Budgets to enable managers to allocate expected expenses to various drug projects, typically with the goal of producing fully loaded expense budgets and reports for each drug under development. When used as part of good business practices in FP&A and R&D departments, a company can improve its financial plans and funding decisions, and it can reduce the chances that there are unexpected cost overruns.
Example of a
Drug Project Budge
t Here is an example of a Drug Development Cost Budget Model with input of expenses by month and by drug. [caption id="" align="alignnone" width="2560"]
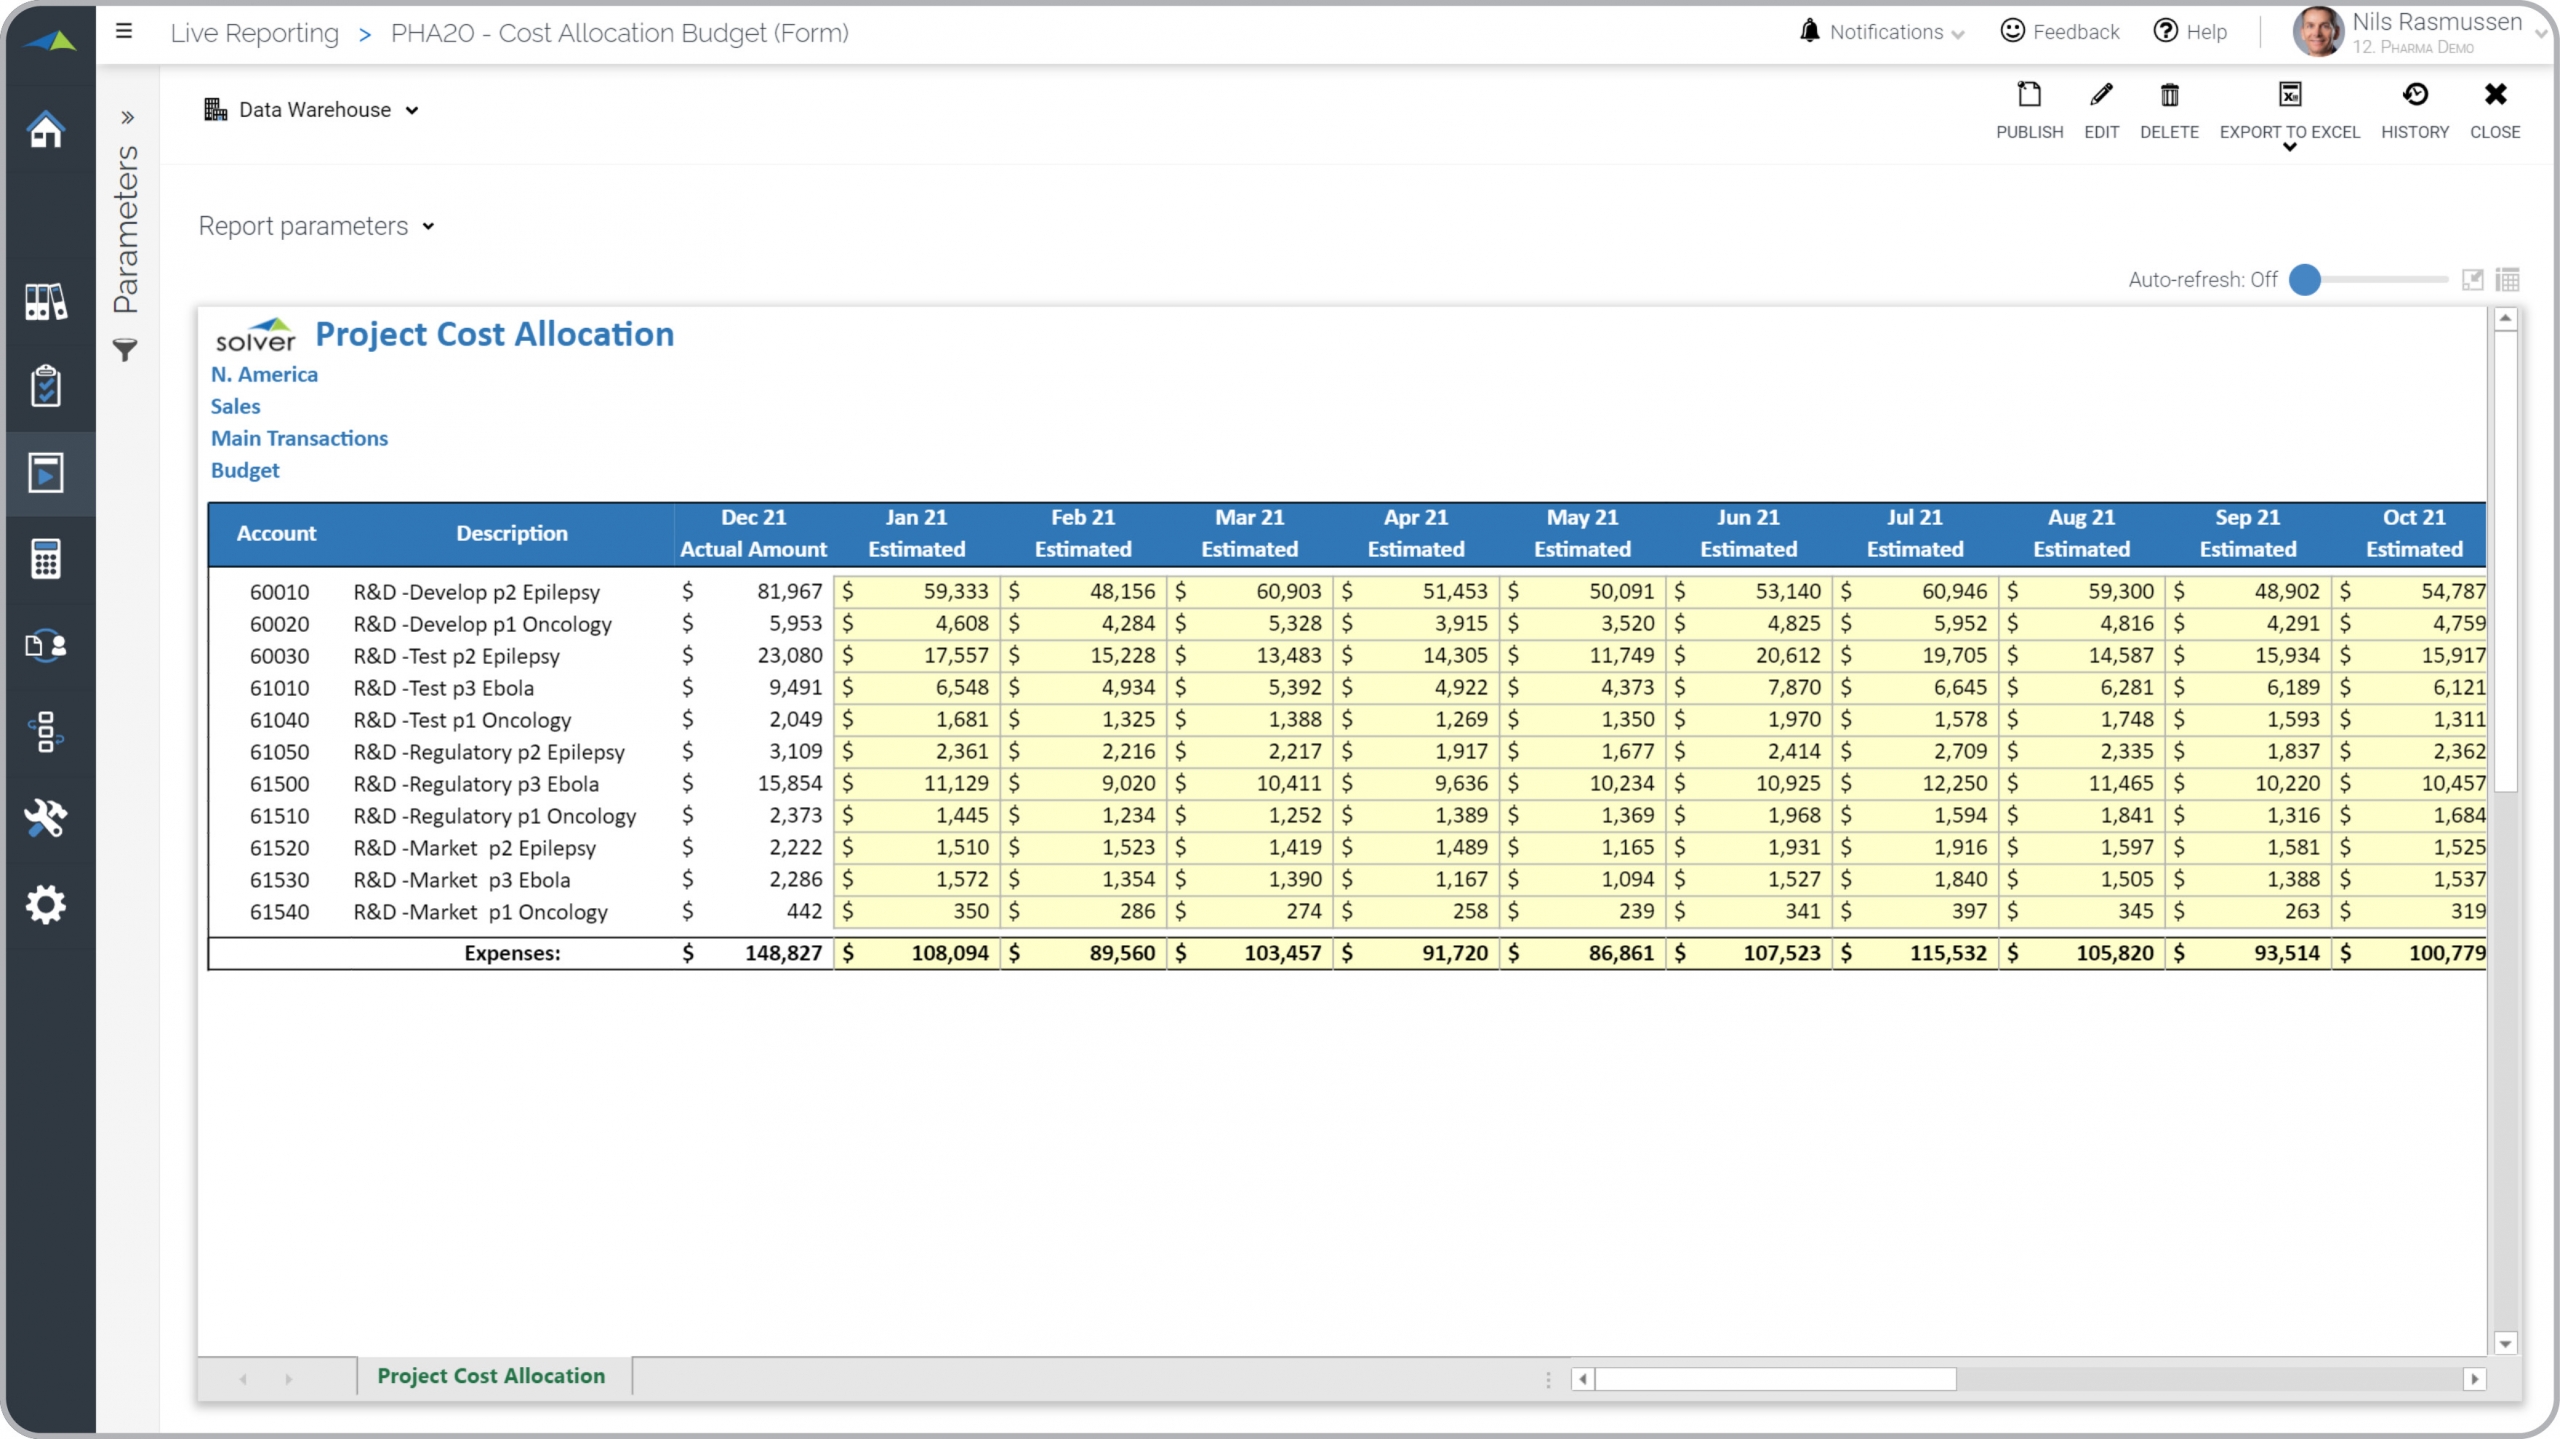 Example of a Drug Project Cost Budget for Pharma Companies[/caption] You can find hundreds of additional examples
here
Who Uses This Type of Planning
Model
? The typical users of this type of forecast and budget model are: R&D managers, budget managers, CFOs, analysts.
Other Reports Often Used in Conjunction with
Drug Development Cost Budget Progressive FP&A and R&D departments sometimes use several different Drug Development Cost Budgets, along with payroll budgets, capital expense budgets, forecasts, profit & loss reports, budget analysis dashboards and other management and control tools.
Where Does the Data for Analysis Originate From? The Actual (historical transactions) data typically comes from enterprise resource planning (ERP) systems like: Microsoft Dynamics 365 (D365) Finance, Microsoft Dynamics 365 Business Central (D365 BC), Microsoft Dynamics AX, Microsoft Dynamics NAV, Microsoft Dynamics GP, Microsoft Dynamics SL, Sage Intacct, Sage 100, Sage 300, Sage 500, Sage X3, SAP Business One, SAP ByDesign, Acumatica, Netsuite and others. In analyses where budgets or forecasts are used, the planning data most often originates from in-house Excel spreadsheet models or from professional corporate performance management (CPM/EPM) solutions.
What Tools are Typically used for Reporting, Planning and Dashboards? Examples of business software used with the data and ERPs mentioned above are:
Example of a Drug Project Cost Budget for Pharma Companies[/caption] You can find hundreds of additional examples
here
Who Uses This Type of Planning
Model
? The typical users of this type of forecast and budget model are: R&D managers, budget managers, CFOs, analysts.
Other Reports Often Used in Conjunction with
Drug Development Cost Budget Progressive FP&A and R&D departments sometimes use several different Drug Development Cost Budgets, along with payroll budgets, capital expense budgets, forecasts, profit & loss reports, budget analysis dashboards and other management and control tools.
Where Does the Data for Analysis Originate From? The Actual (historical transactions) data typically comes from enterprise resource planning (ERP) systems like: Microsoft Dynamics 365 (D365) Finance, Microsoft Dynamics 365 Business Central (D365 BC), Microsoft Dynamics AX, Microsoft Dynamics NAV, Microsoft Dynamics GP, Microsoft Dynamics SL, Sage Intacct, Sage 100, Sage 300, Sage 500, Sage X3, SAP Business One, SAP ByDesign, Acumatica, Netsuite and others. In analyses where budgets or forecasts are used, the planning data most often originates from in-house Excel spreadsheet models or from professional corporate performance management (CPM/EPM) solutions.
What Tools are Typically used for Reporting, Planning and Dashboards? Examples of business software used with the data and ERPs mentioned above are:
- Native ERP report writers and query tools
- Spreadsheets (for example Microsoft Excel)
- Corporate Performance Management (CPM) tools (for example Solver)
- Dashboards (for example Microsoft Power BI and Tableau)
- View 100’s of reporting, consolidations, planning, budgeting, forecasting and dashboard examples here
- View a Pharma Industry white paper and other industry-specific information here
- See how reports are designed in a modern report writer using a cloud-connected Excel add-in writer
- Discover how the Solver CPM solution delivers financial and operational reporting
- Discover how the Solver CPM solution delivers planning, budgeting and forecasting
- Watch demo videos of reporting, planning and dashboards
July 31, 2021
TAGS: Reporting, Solver, report writer, Microsoft, template, practice, Acumatica, Netsuite, Finance, planning, GP, pharmaceutical, Business Central, excel, ax, expense, forecast, Budget, Dynamics 365, budgeting, Cloud, Software, product, Tableau, SAP, example, best, Sage, BC, D365, NAV, Intacct, pharma, project, CPM, report, SL, Management, dynamics, Power BI, drug, projected expenses, R&D, allocated cost