
What is
a
Driver-based Sales Forecast
? Driver-based sales forecasts are considered essential planning tools and are used by sales managers to estimate sales in upcoming months. A key functionality in this type of forecast template allows the sales manager to automatically generate sales per sales person based on break-back of the full year sales target. Next, manual adjustments can be made at the row level to apply relevant exceptions. Variance between total forecasted sales and the original sales budget is displayed on the top of the form. You will find an example of this type of forecast template below.
 Purpose of
Driver-based Sales Forecast Templates Companies and organizations use Driver-based Sales Forecast Templates to enable all departments that have a dependency on sales to stay on top of their related plans. When used as part of good business practices in a Sales Department, a company can improve its sales-related plans and activities as well as reduce the risk that the company misses its profit targets or experiences issues with its supply chain.
Driver-based Sales Forecast Template
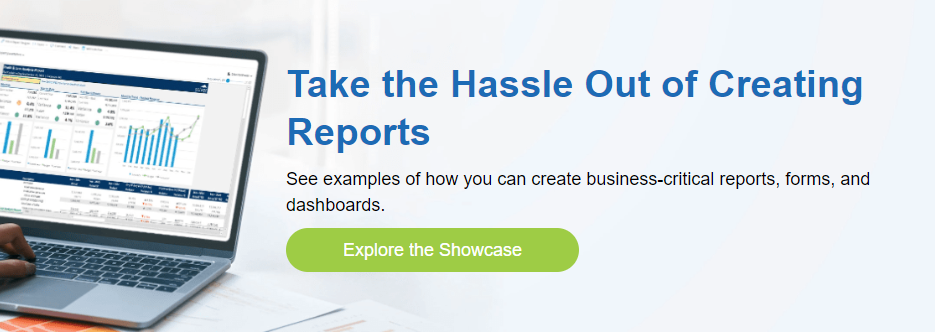
Example Here is an example of a driver-based Sales Forecast Input Template. [caption id="" align="alignnone" width="1743"]
Purpose of
Driver-based Sales Forecast Templates Companies and organizations use Driver-based Sales Forecast Templates to enable all departments that have a dependency on sales to stay on top of their related plans. When used as part of good business practices in a Sales Department, a company can improve its sales-related plans and activities as well as reduce the risk that the company misses its profit targets or experiences issues with its supply chain.
Driver-based Sales Forecast Template
Example Here is an example of a driver-based Sales Forecast Input Template. [caption id="" align="alignnone" width="1743"]
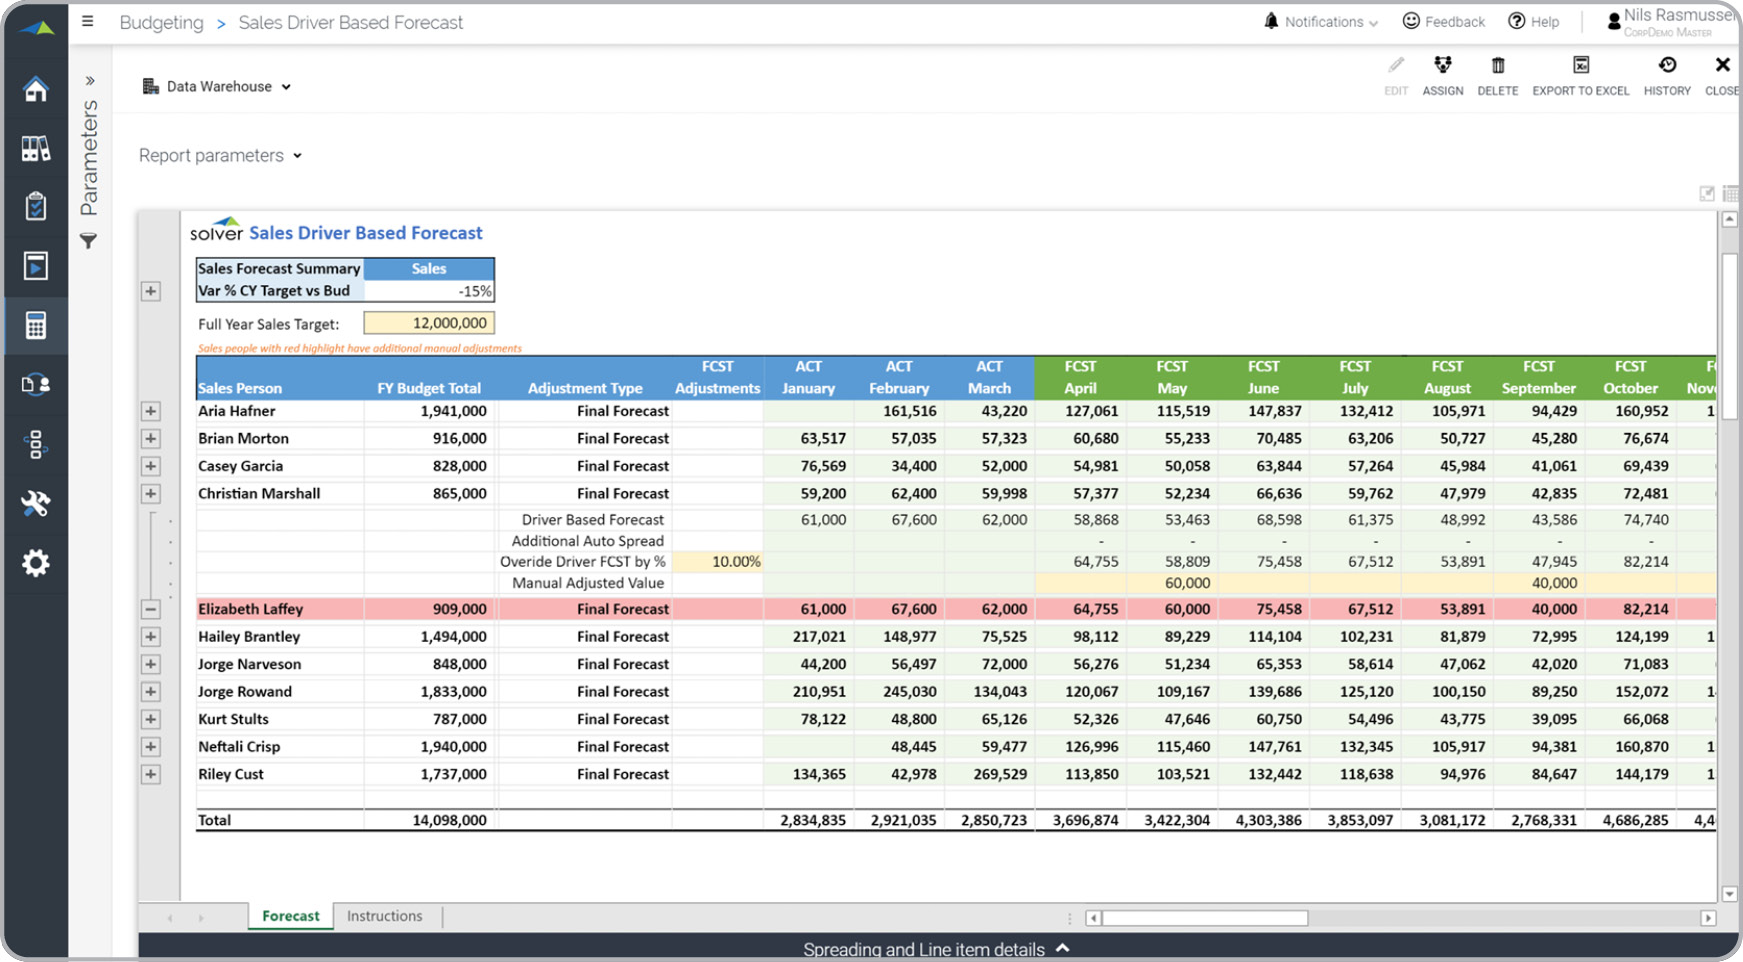 Driver-based Sales Forecast Template[/caption] You can find 100’s of additional examples
here.
Who Uses This Type of
Forecast Template
? The typical users of this type of forecast template are: Sales Executives and other managers.
Other
Forecast Template
s Often Used in Conjunction with
Driver-based Sales Forecast Templates Progressive Sales Departments sometimes use several different Driver-based Sales Forecast Templates, along with sales reports, sales dashboards, financial forecast reports and other management and control tools.
Where Does the Data for Analysis Originate From? The Actual (historical transactions) data typically comes from enterprise resource planning (ERP) systems like: Microsoft Dynamics 365 (D365) Finance, Microsoft Dynamics 365 Business Central (D365 BC), Microsoft Dynamics AX, Microsoft Dynamics NAV, Microsoft Dynamics SL, Sage Intacct, Sage 100, Sage 300, Sage 500, Sage X3, SAP Business One, SAP ByDesign, Netsuite and others. In analyses where budgets or forecasts are used, the data most often originates from in-house Excel spreadsheet models or from professional corporate performance management (CPM/EPM) solutions.
What Tools are Typically used for Reporting, Planning and Dashboards? Examples of business software used with the data and ERPs mentioned above are:
Driver-based Sales Forecast Template[/caption] You can find 100’s of additional examples
here.
Who Uses This Type of
Forecast Template
? The typical users of this type of forecast template are: Sales Executives and other managers.
Other
Forecast Template
s Often Used in Conjunction with
Driver-based Sales Forecast Templates Progressive Sales Departments sometimes use several different Driver-based Sales Forecast Templates, along with sales reports, sales dashboards, financial forecast reports and other management and control tools.
Where Does the Data for Analysis Originate From? The Actual (historical transactions) data typically comes from enterprise resource planning (ERP) systems like: Microsoft Dynamics 365 (D365) Finance, Microsoft Dynamics 365 Business Central (D365 BC), Microsoft Dynamics AX, Microsoft Dynamics NAV, Microsoft Dynamics SL, Sage Intacct, Sage 100, Sage 300, Sage 500, Sage X3, SAP Business One, SAP ByDesign, Netsuite and others. In analyses where budgets or forecasts are used, the data most often originates from in-house Excel spreadsheet models or from professional corporate performance management (CPM/EPM) solutions.
What Tools are Typically used for Reporting, Planning and Dashboards? Examples of business software used with the data and ERPs mentioned above are:
 Corporate Performance Management (CPM) Technology Solutions and More Examples
 Driver-based Sales Forecast Template[/caption] You can find 100’s of additional examples
here.
Who Uses This Type of
Forecast Template
? The typical users of this type of forecast template are: Sales Executives and other managers.
Other
Forecast Template
s Often Used in Conjunction with
Driver-based Sales Forecast Templates Progressive Sales Departments sometimes use several different Driver-based Sales Forecast Templates, along with sales reports, sales dashboards, financial forecast reports and other management and control tools.
Where Does the Data for Analysis Originate From? The Actual (historical transactions) data typically comes from enterprise resource planning (ERP) systems like: Microsoft Dynamics 365 (D365) Finance, Microsoft Dynamics 365 Business Central (D365 BC), Microsoft Dynamics AX, Microsoft Dynamics NAV, Microsoft Dynamics SL, Sage Intacct, Sage 100, Sage 300, Sage 500, Sage X3, SAP Business One, SAP ByDesign, Netsuite and others. In analyses where budgets or forecasts are used, the data most often originates from in-house Excel spreadsheet models or from professional corporate performance management (CPM/EPM) solutions.
What Tools are Typically used for Reporting, Planning and Dashboards? Examples of business software used with the data and ERPs mentioned above are:
Driver-based Sales Forecast Template[/caption] You can find 100’s of additional examples
here.
Who Uses This Type of
Forecast Template
? The typical users of this type of forecast template are: Sales Executives and other managers.
Other
Forecast Template
s Often Used in Conjunction with
Driver-based Sales Forecast Templates Progressive Sales Departments sometimes use several different Driver-based Sales Forecast Templates, along with sales reports, sales dashboards, financial forecast reports and other management and control tools.
Where Does the Data for Analysis Originate From? The Actual (historical transactions) data typically comes from enterprise resource planning (ERP) systems like: Microsoft Dynamics 365 (D365) Finance, Microsoft Dynamics 365 Business Central (D365 BC), Microsoft Dynamics AX, Microsoft Dynamics NAV, Microsoft Dynamics SL, Sage Intacct, Sage 100, Sage 300, Sage 500, Sage X3, SAP Business One, SAP ByDesign, Netsuite and others. In analyses where budgets or forecasts are used, the data most often originates from in-house Excel spreadsheet models or from professional corporate performance management (CPM/EPM) solutions.
What Tools are Typically used for Reporting, Planning and Dashboards? Examples of business software used with the data and ERPs mentioned above are:
- Native ERP report writers and query tools
- Spreadsheets (for example Microsoft Excel)
- Corporate Performance Management (CPM) tools (for example Solver)
- Dashboards (for example Microsoft Power BI and Tableau)
- View 100’s of reporting, consolidations, planning, budgeting, forecasting and dashboard examples here
- Discover how the Solver CPM solution delivers financial and operational reporting
- Discover how the Solver CPM solution delivers planning, budgeting and forecasting
- Watch demo videos of reporting, planning and dashboards
June 19, 2020