
What is
a
Consolidating Year-to-Date Profit & Loss Report
? Consolidating Profit & Loss (P&L) reports are considered important month-end reports and are used by CFOs and Group Controllers to analyze consolidated financial results. Key functionality in this type of report will display year-to-date (YTD) data for subsidiaries across the columns with a consolidated total. The report can be produced in any currency and the charts on the top provide managers with easy comparative analysis. You will find an example of this type of report below.
Purpose of
Consolidating Profit & Loss Reports Companies and organizations use Consolidating Profit & Loss Reports to view subsidiary and consolidated YTD revenues, expenses and profit side-by-side. When used as part of good business practices in a Finance & Accounting Department, a company can improve its month-end and YTD analysis capabilities, as well as, mitigate the risk that HQ executives lack clarity in the individual YTD contributors to the consolidated results.
Consolidating Profit & Loss Report
Example Here is an example of a modern, consolidating YTD Profit & Loss report. [caption id="" align="alignnone" width="2560"]
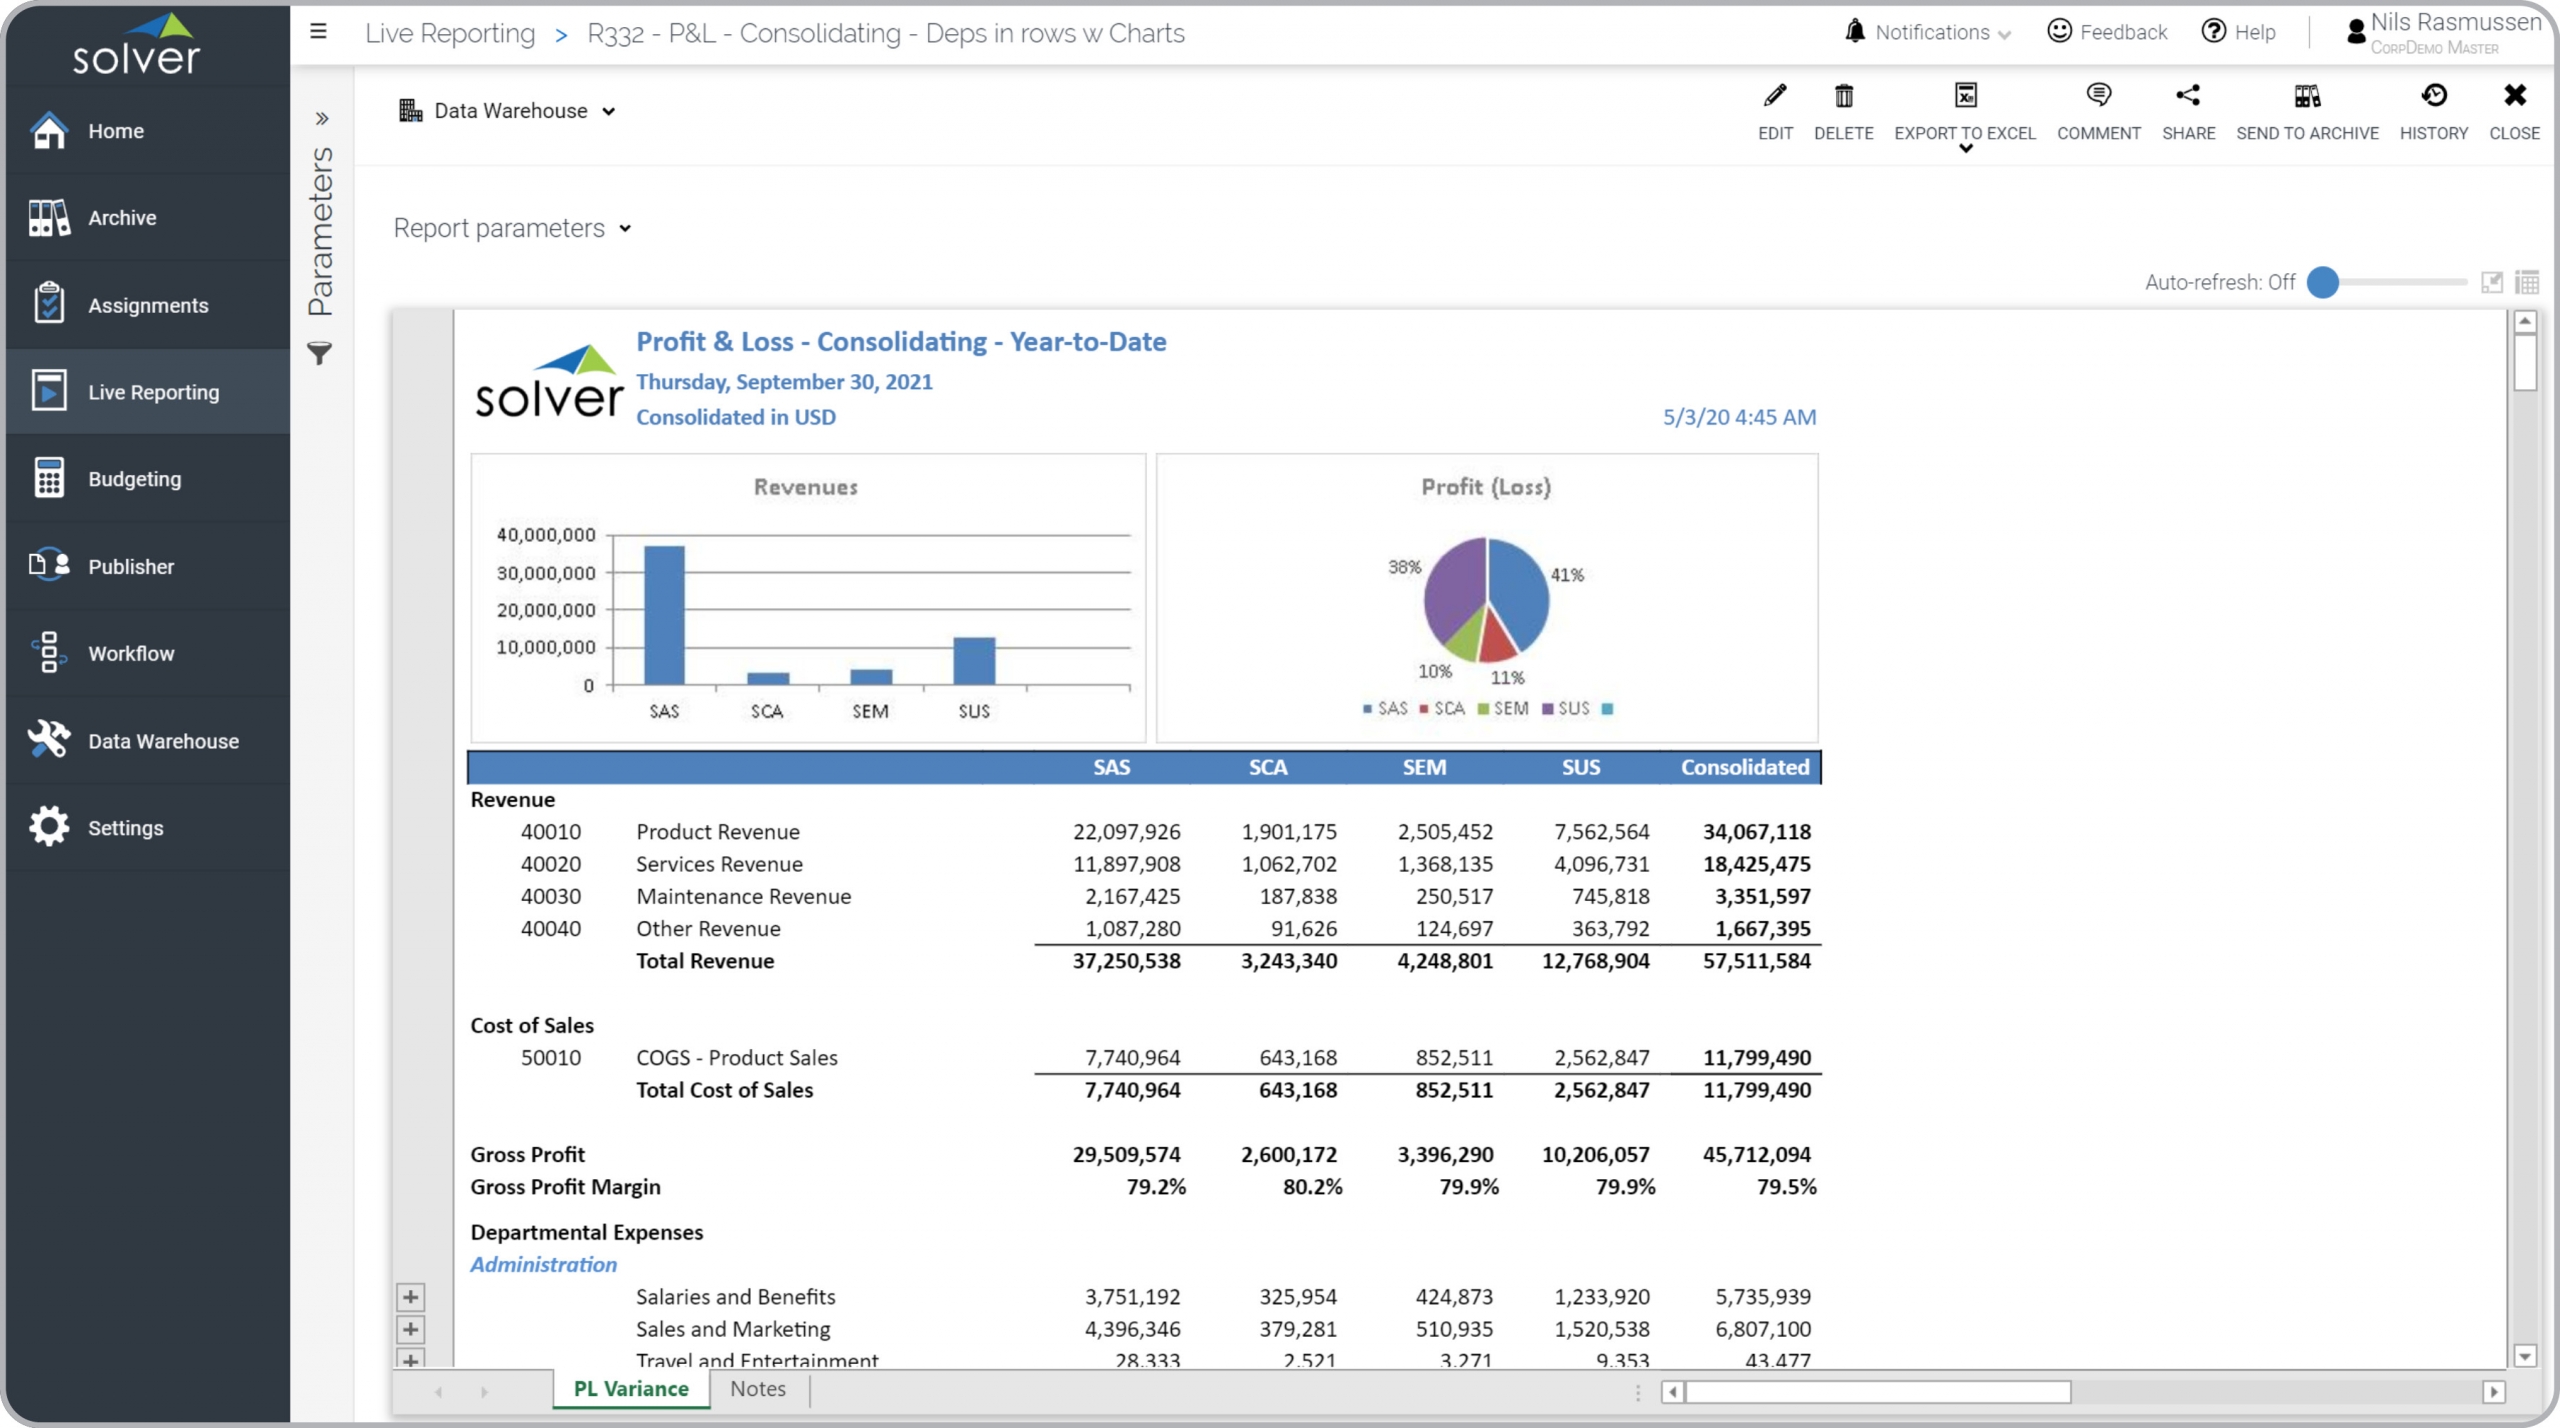 Consolidating Year-to-Date Profit & Loss Report Example[/caption] You can find hundreds of additional examples
here.
Who Uses This Type of
Report
? The typical users of this type of report are: Executives, CFOs and Controllers.
Other
Report
s Often Used in Conjunction with
Consolidating Profit & Loss Reports Progressive Finance & Accounting Departments sometimes use several different Consolidating Profit & Loss Reports, along with consolidating balance sheet and cash flow reports and other management and control tools.
Where Does the Data for Analysis Originate From? The Actual (historical transactions) data typically comes from enterprise resource planning (ERP) systems like: Microsoft Dynamics 365 (D365) Finance, Microsoft Dynamics 365 Business Central (D365 BC), Microsoft Dynamics AX, Microsoft Dynamics NAV, Microsoft Dynamics GP, Microsoft Dynamics SL, Sage Intacct, Sage 100, Sage 300, Sage 500, Sage X3, SAP Business One, SAP ByDesign, Acumatica, Netsuite and others. In analyses where budgets or forecasts are used, the planning data most often originates from in-house Excel spreadsheet models or from professional corporate performance management (CPM/EPM) solutions.
What Tools are Typically used for Reporting, Planning and Dashboards? Examples of business software used with the data and ERPs mentioned above are:
Consolidating Year-to-Date Profit & Loss Report Example[/caption] You can find hundreds of additional examples
here.
Who Uses This Type of
Report
? The typical users of this type of report are: Executives, CFOs and Controllers.
Other
Report
s Often Used in Conjunction with
Consolidating Profit & Loss Reports Progressive Finance & Accounting Departments sometimes use several different Consolidating Profit & Loss Reports, along with consolidating balance sheet and cash flow reports and other management and control tools.
Where Does the Data for Analysis Originate From? The Actual (historical transactions) data typically comes from enterprise resource planning (ERP) systems like: Microsoft Dynamics 365 (D365) Finance, Microsoft Dynamics 365 Business Central (D365 BC), Microsoft Dynamics AX, Microsoft Dynamics NAV, Microsoft Dynamics GP, Microsoft Dynamics SL, Sage Intacct, Sage 100, Sage 300, Sage 500, Sage X3, SAP Business One, SAP ByDesign, Acumatica, Netsuite and others. In analyses where budgets or forecasts are used, the planning data most often originates from in-house Excel spreadsheet models or from professional corporate performance management (CPM/EPM) solutions.
What Tools are Typically used for Reporting, Planning and Dashboards? Examples of business software used with the data and ERPs mentioned above are:
- Native ERP report writers and query tools
- Spreadsheets (for example Microsoft Excel)
- Corporate Performance Management (CPM) tools (for example Solver)
- Dashboards (for example Microsoft Power BI and Tableau)
- View 100’s of reporting, consolidations, planning, budgeting, forecasting and dashboard examples here
- Discover how the Solver CPM solution delivers financial and operational reporting
- Discover how the Solver CPM solution delivers planning, budgeting and forecasting
- Watch demo videos of reporting, planning and dashboards
July 21, 2020
TAGS: Reporting, Solver, report writer, Microsoft, consolidation, template, practice, Acumatica, Netsuite, Finance, Profit and Loss, GP, consolidating, Business Central, excel, ax, income statement, budgeting, Cloud, Software, Tableau, SAP, example, best, Sage, BC, P&L, D365, NAV, Intacct, CPM, report, SL, Management, dynamics, Power BI