Support
Login
English (NA)
English (EMEA)
English (APAC)
Spanish
French
German
Italian
Portuguese
Danish
Norwegian
Product
Solver FP&A
Solver Copilot AI
Planning
Reporting
Consolidation
Analysis
Pricing
Data Warehouse
ERP Consolidator
Migration Mapper
Template Marketplace
QuickStart Deployment
Integrations
Solutions
By Role
CFO
Financial Controller
FP&A Manager
Senior Accountant
Industries
Nonprofit
Manufacturing
Distribution
Retail
Construction
Healthcare
Finance
SaaS
Browse All Industries
→
Partners
Partner Program
Partner Directory
Partner Portal
Resources
Learn
Resource Library
Blog
Events
ASCEND
Training
On-Demand Training
Consulting
Community
Proof
Customer Stories
Product Demo
Solver Copilot Demo
About
Company
Careers
Press
Contact Us
Request Demo
Request Demo
Template Library Glossary
Recent Posts
Workforce Efficiency Dashboard for SaaS Companies using Dynamics 365 Business Central
Subscription Billing Auto Forecast for SaaS Companies using Dynamics 365 Business Central
Headcount Dashboard for SaaS Companies using Dynamics 365 Business Central
Filter Posts
Analysis
Budgeting
CRM
Compare FP&A
Consolidation
Dashboards
Data warehouse
ERP
FP&A
Financial Reporting
Forecasting
Industry
KPIs
Partners
Planning
Reporting
Template Library
Subscribe Today
VIEW SHOWCASE EXAMPLES
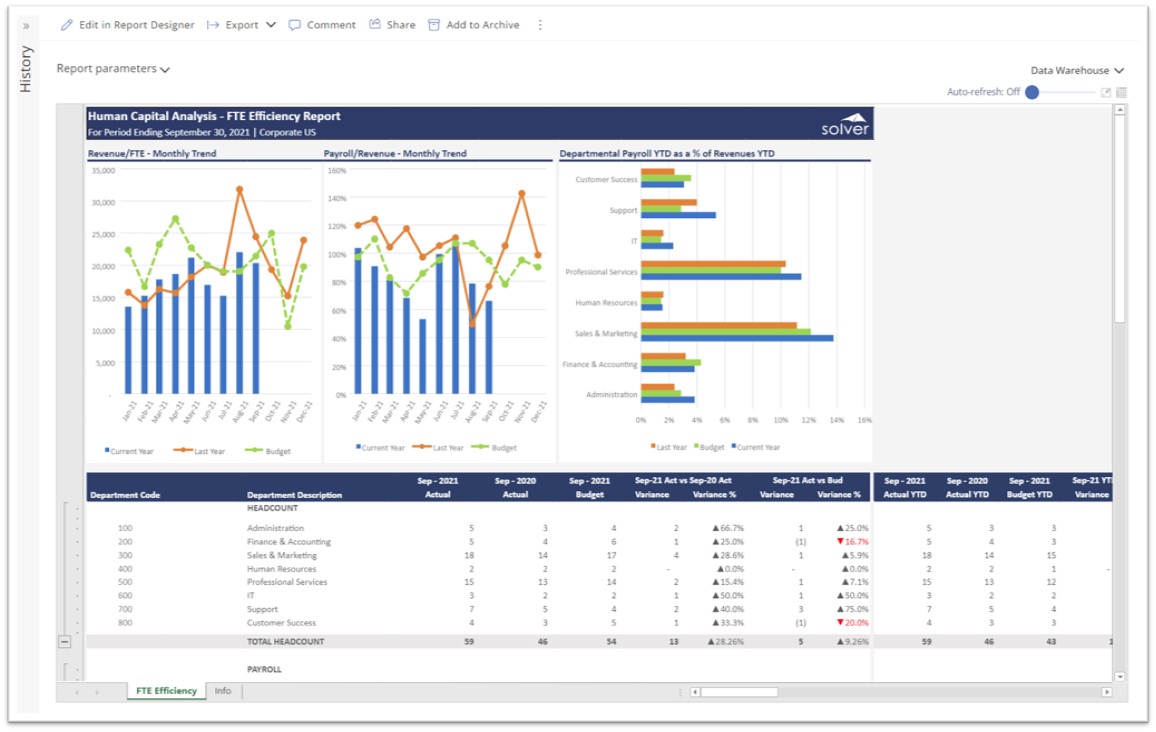
Workforce Efficiency Dashboard for SaaS Companies using Dynamics 365 Business Central
This article describes the Workforce Efficiency Dashboard that is included with Solver's SaaS model ...
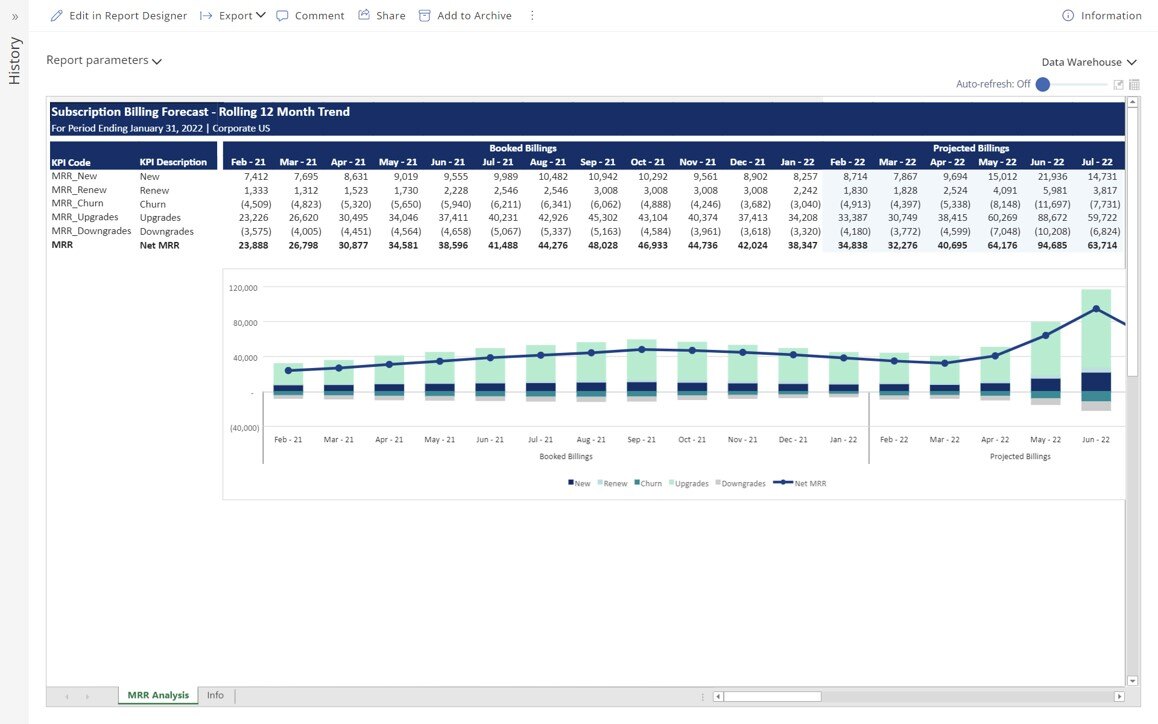
Subscription Billing Auto Forecast for SaaS Companies using Dynamics 365 Business Central
This article describes the Subscription Billing Auto Forecast Report that is included with Solver's ...
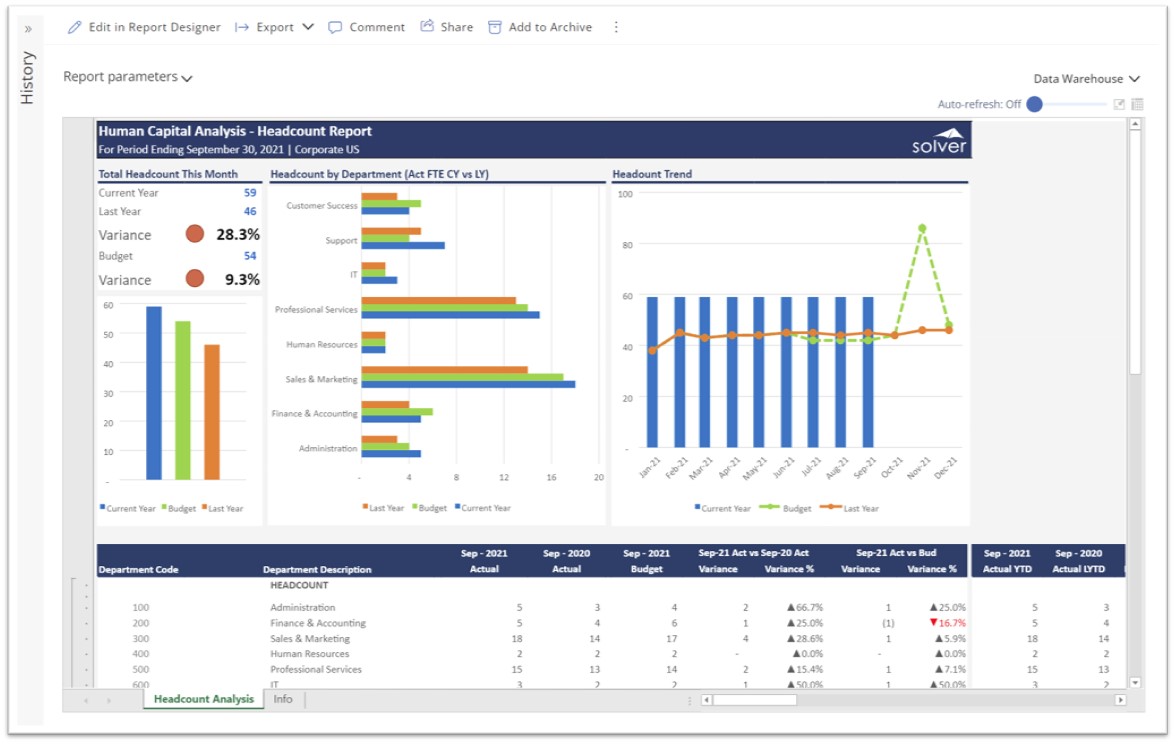
Headcount Dashboard for SaaS Companies using Dynamics 365 Business Central
This article describes the Compensation Dashboard that is included with Solver's SaaS model for ...
Pipeline Trend Dashboard for SaaS Companies using Dynamics 365 BC
Introduction In the dynamic landscape of SaaS (Software as a Service) companies, staying ahead of ...
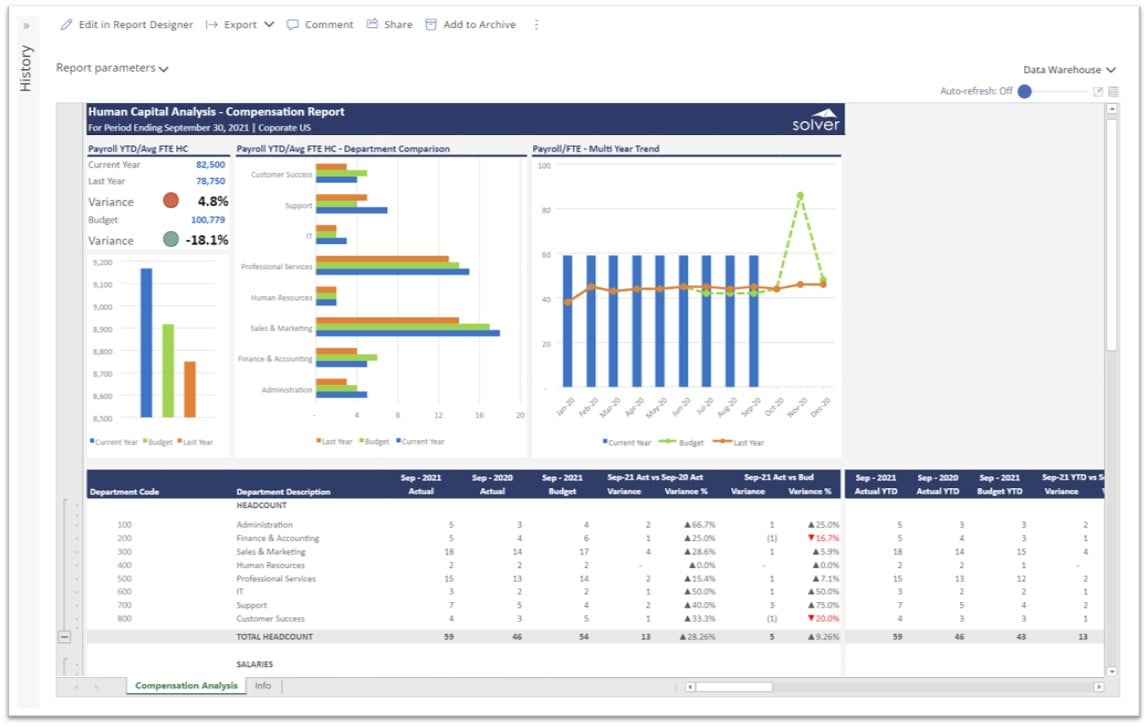
Compensation Dashboard for SaaS Companies using Dynamics 365 Business Central
This article describes the Compensation Dashboard that is included with Solver's SaaS model for ...
Multi-Year Profit & Loss Forecast Model for SaaS Companies using Dynamics 365 Business Central
This article describes the Five-Year Profit & Loss Forecast Template that is included with ...
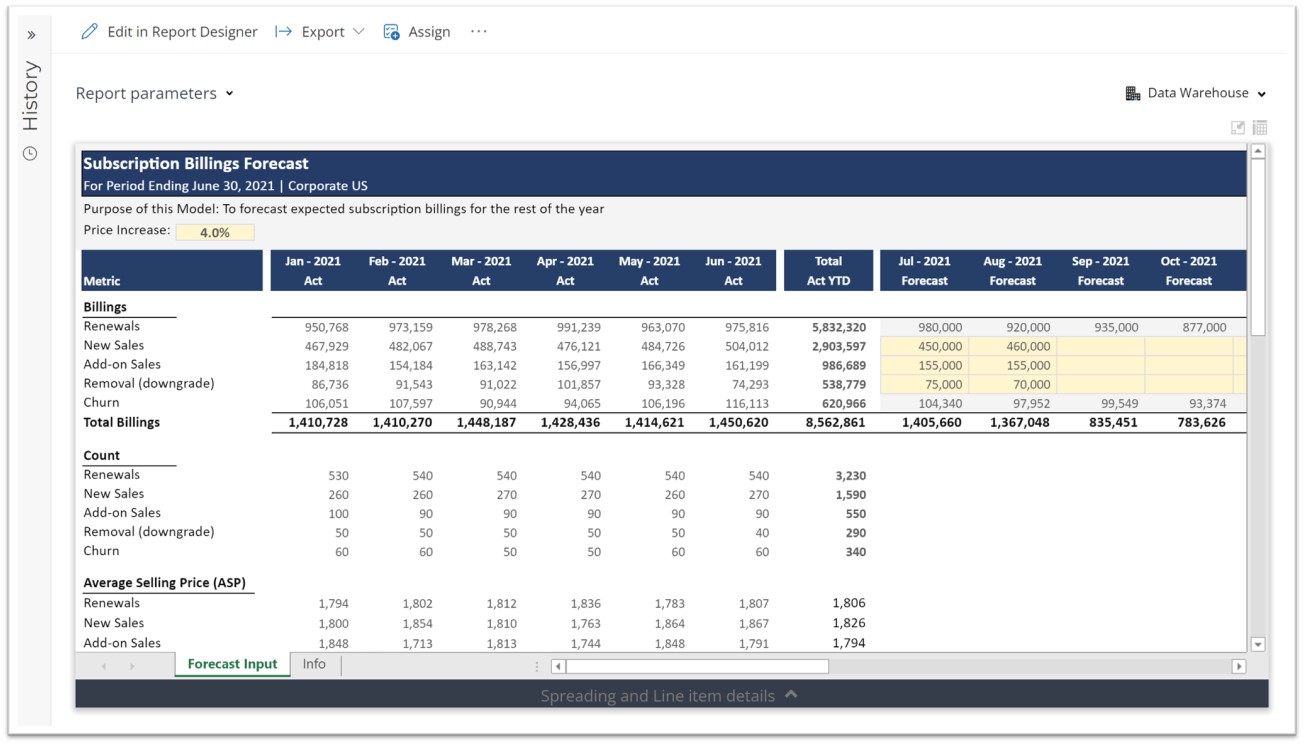
Subscription Billings Forecast for SaaS Companies using Dynamics 365 Business Central
This article describes the Subscription Billings Forecast Template that is included with Solver's ...
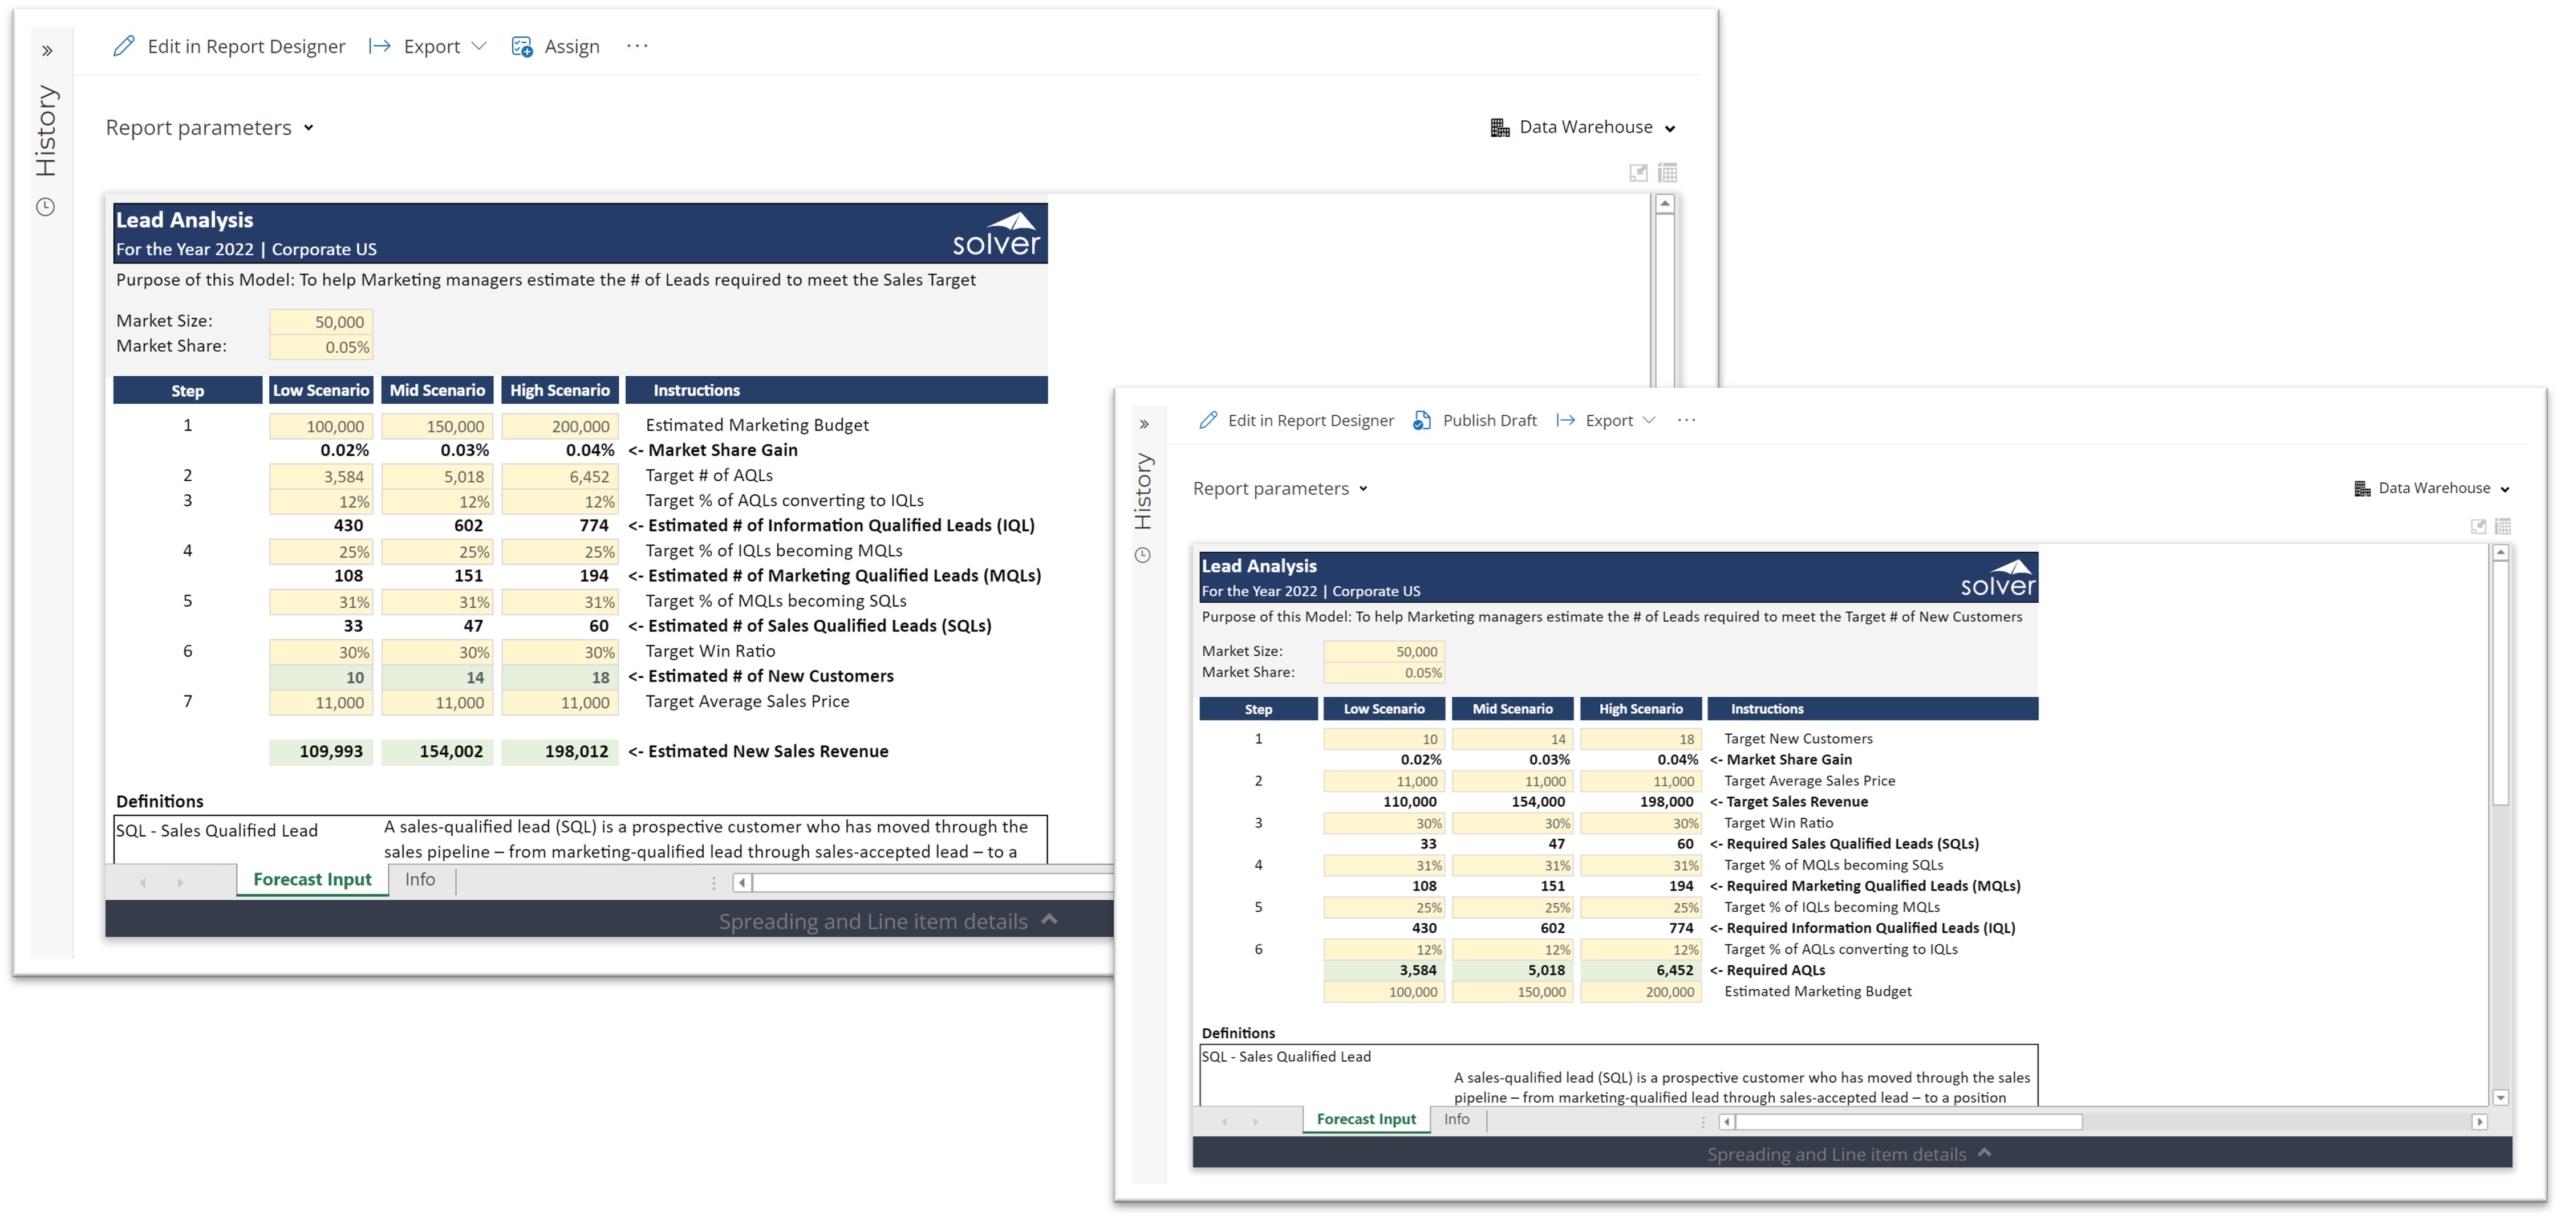
Lead Target Model for SaaS Companies using Dynamics 365 Business Central
This article describes the Lead Target Template that is included with Solver's SaaS model for users ...
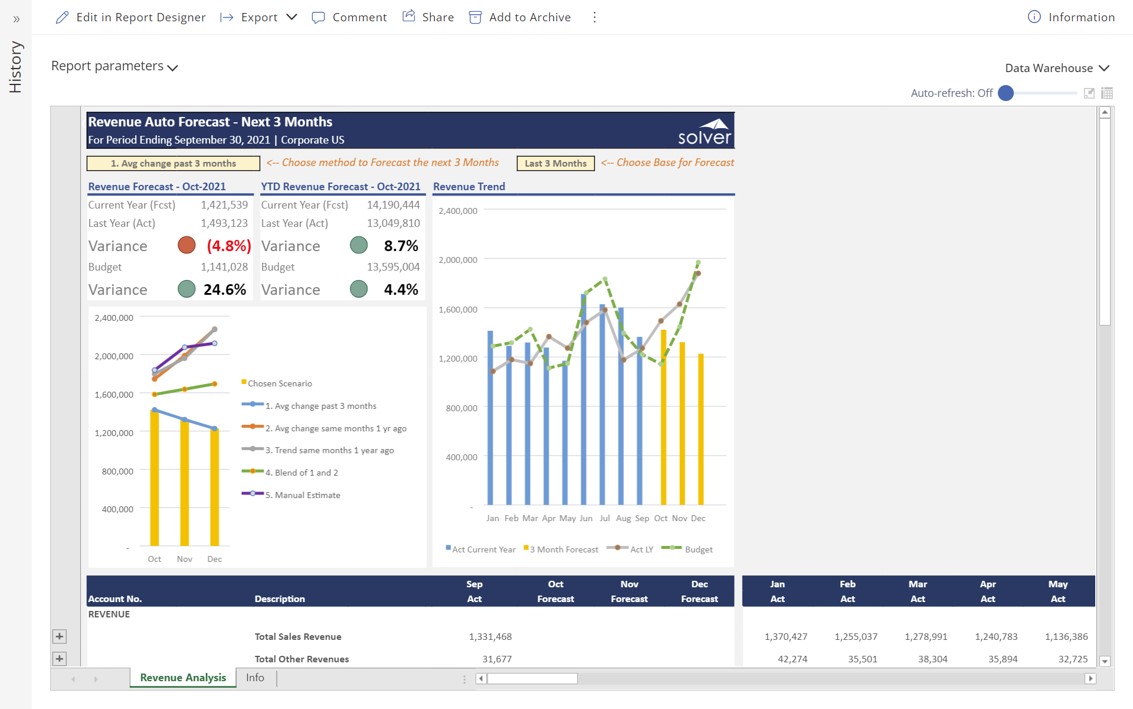
Automated Revenue Forecast for SaaS Companies using Dynamics 365 Business Central
This article describes the Revenue Auto Forecast Template that is included with Solver's SaaS model ...
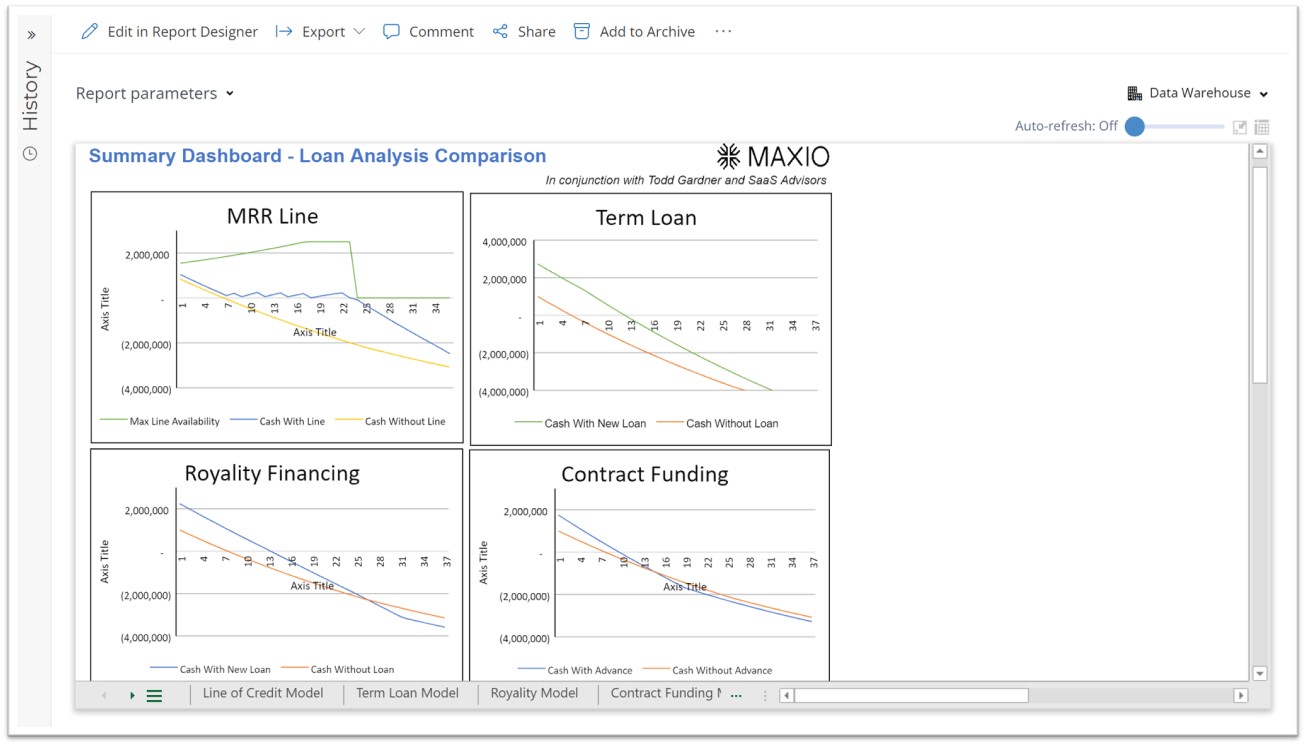
Loan Analysis Model for SaaS Companies using Dynamics 365 Business Central
This article describes the Loan Analysis Template that is included with Solver's SaaS model for ...
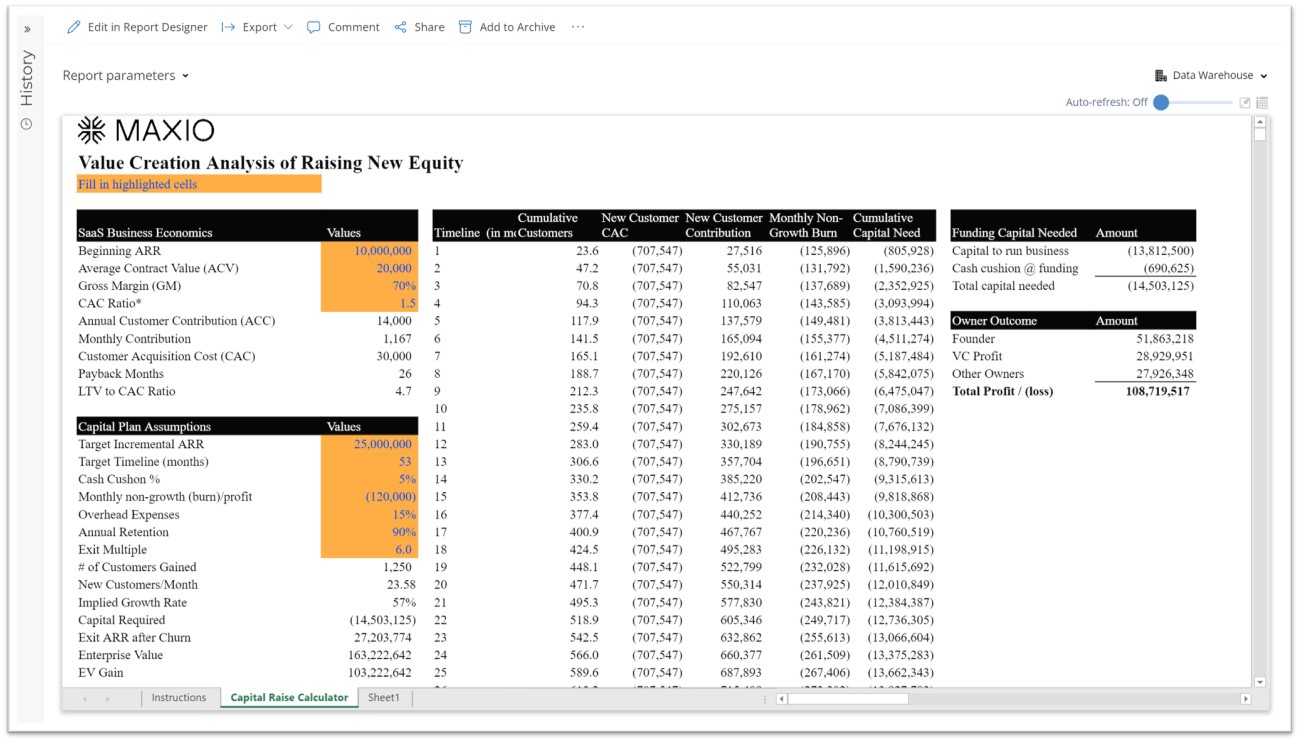
Value Creation of Raising New Equity Template for SaaS Companies using Dynamics 365 Business Central
This article describes the Value Creation of Raising New Equity Template that is included with ...
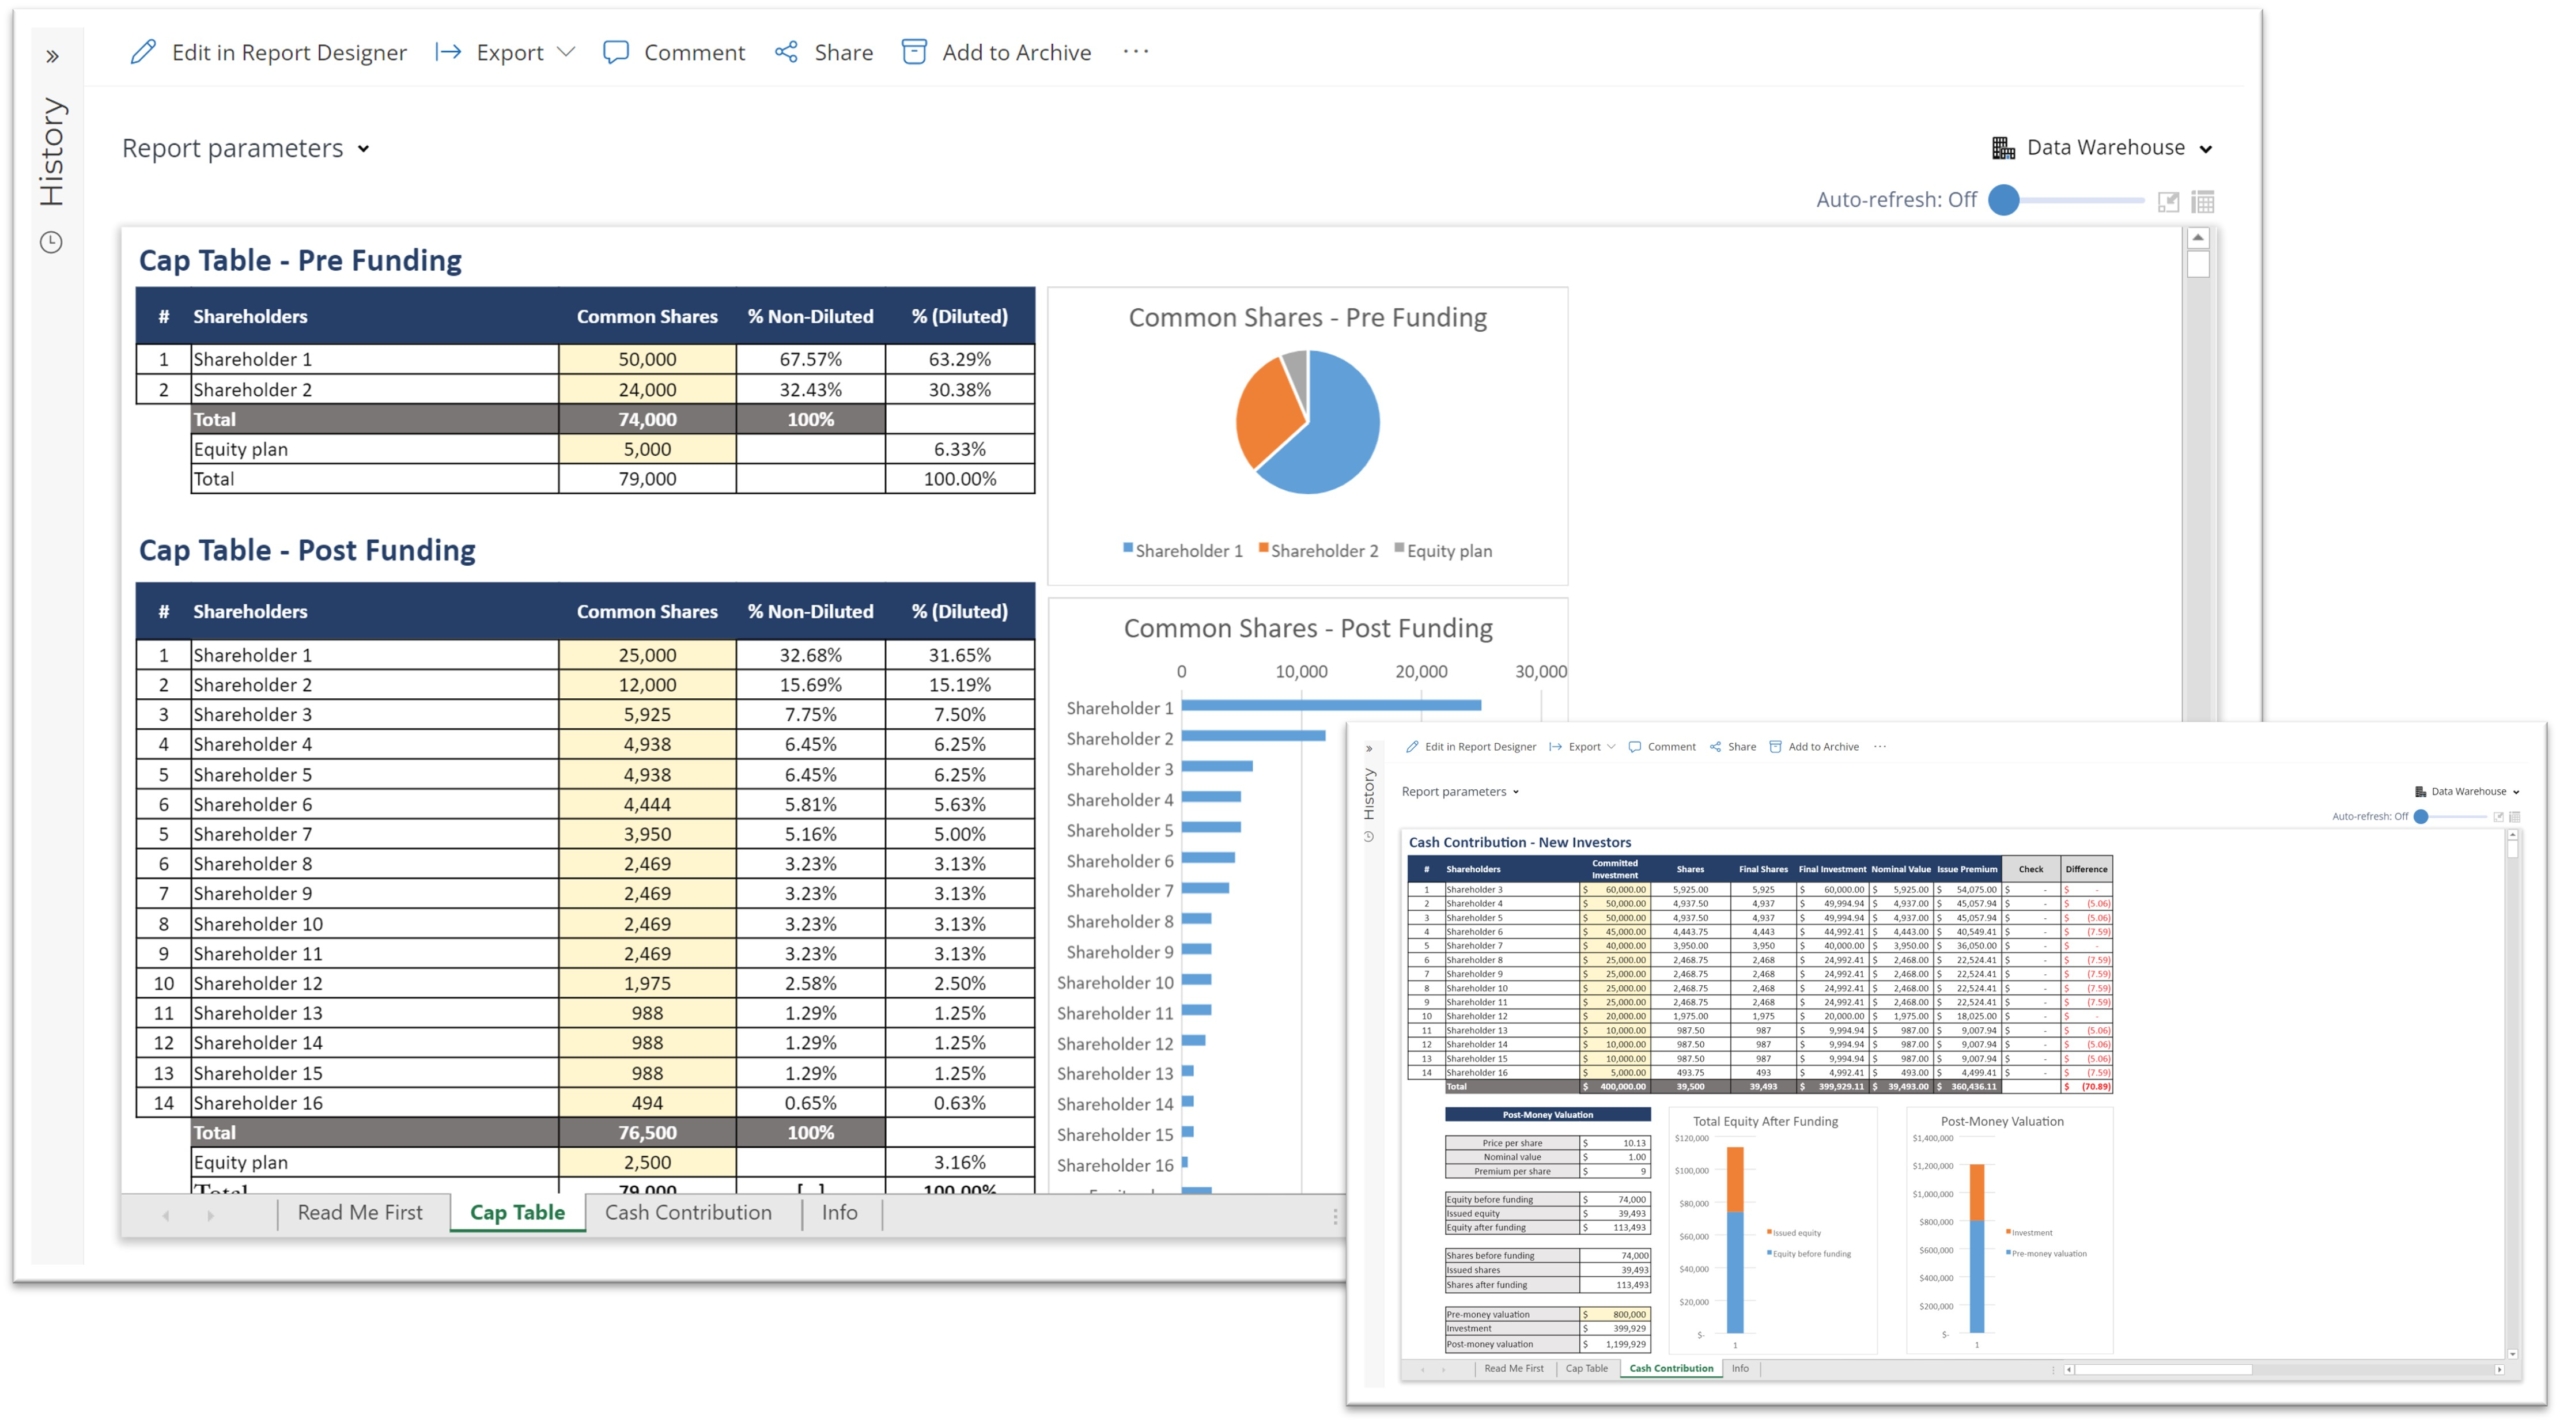
Cap Table Template for SaaS Companies using Dynamics 365 Business Central
This article describes the Cap Table Template that is included with Solver's SaaS model for users ...
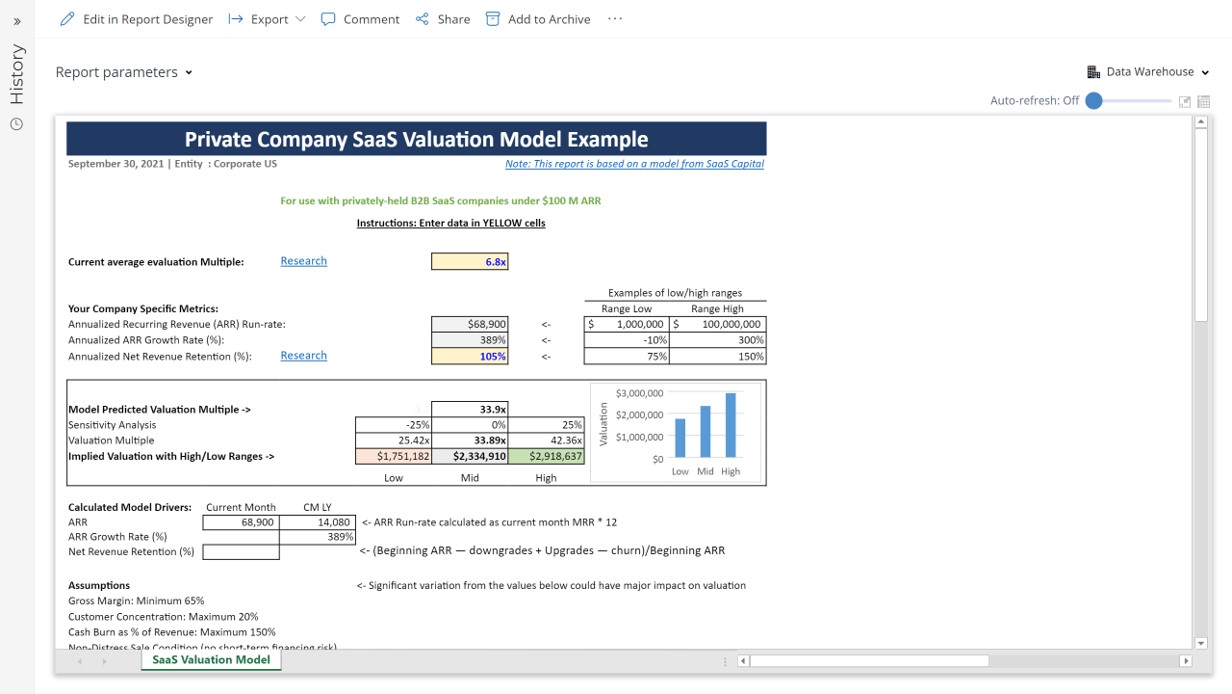
Evaluation Model for SaaS Companies using Dynamics 365 Business Central
This article describes the Evaluation Model Report that is included with Solver's SaaS model for ...
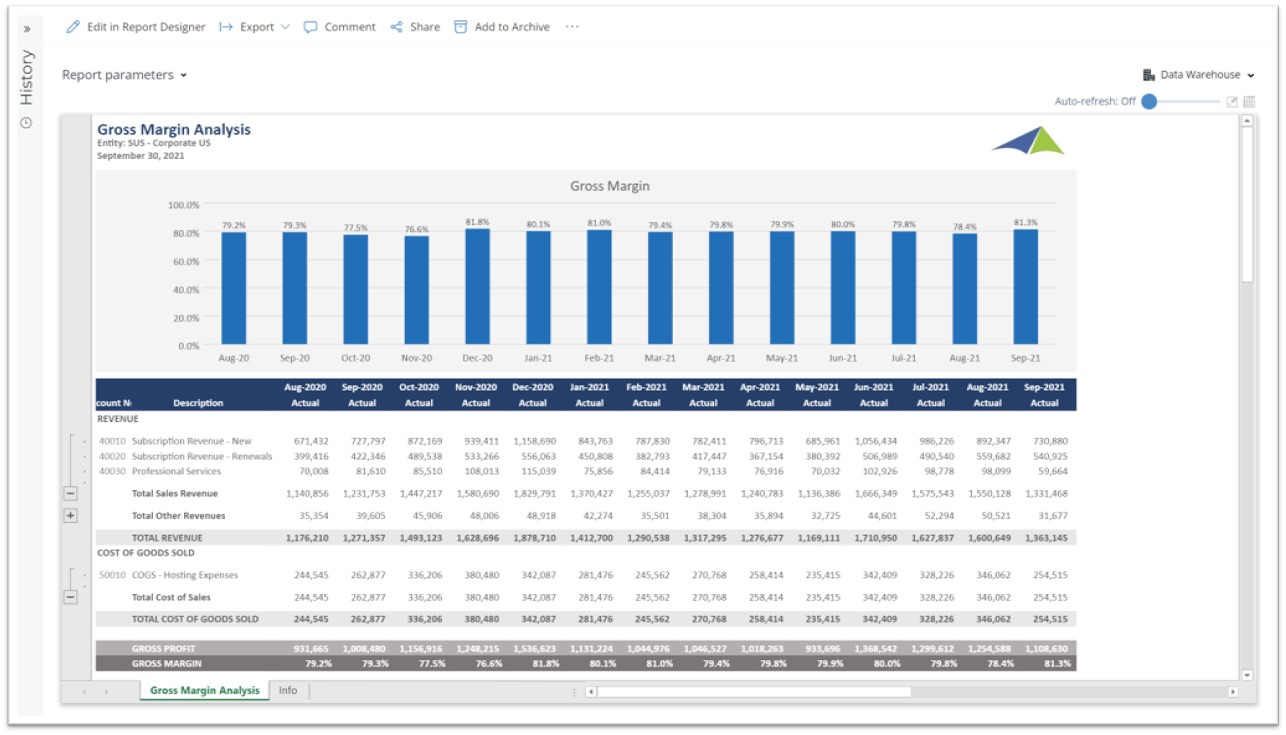
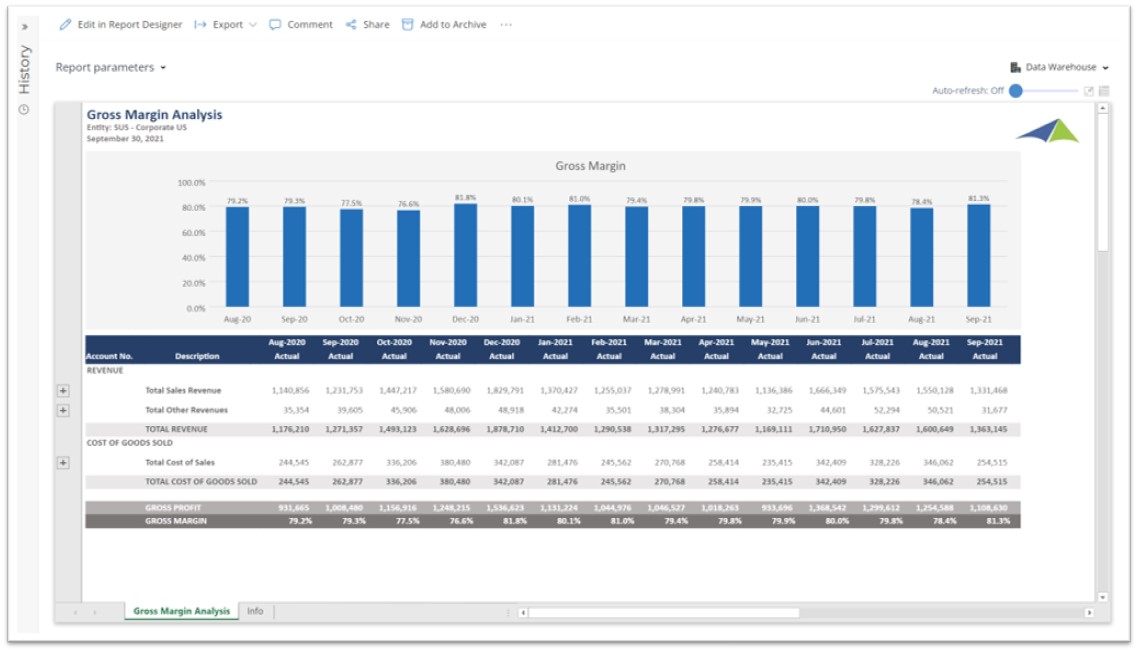
Gross Margin Analysis Report for SaaS Companies using Dynamics 365 Business Central
This article describes the Gross Margin Analysis Report that is included with Solver's SaaS model ...
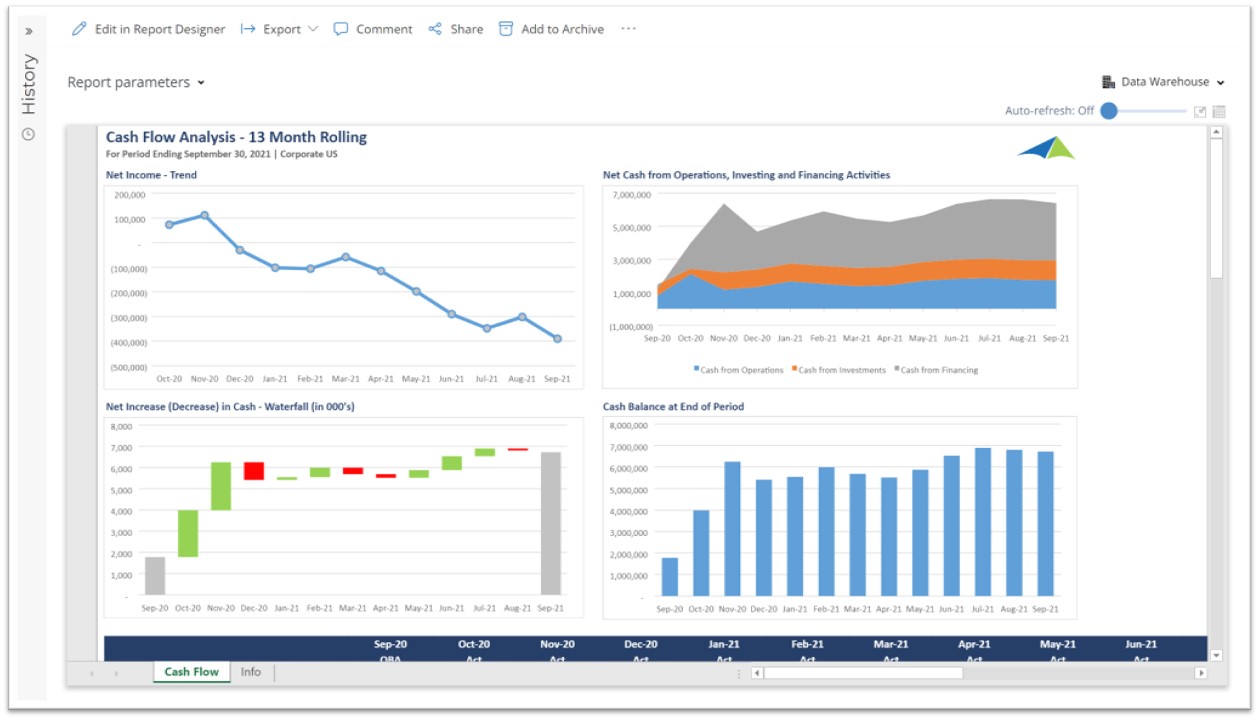
Cash Flow Dashboard for SaaS Companies using Dynamics 365 Business Central
This article describes the Cash Flow Dashboard that is included with Solver's SaaS model for users ...
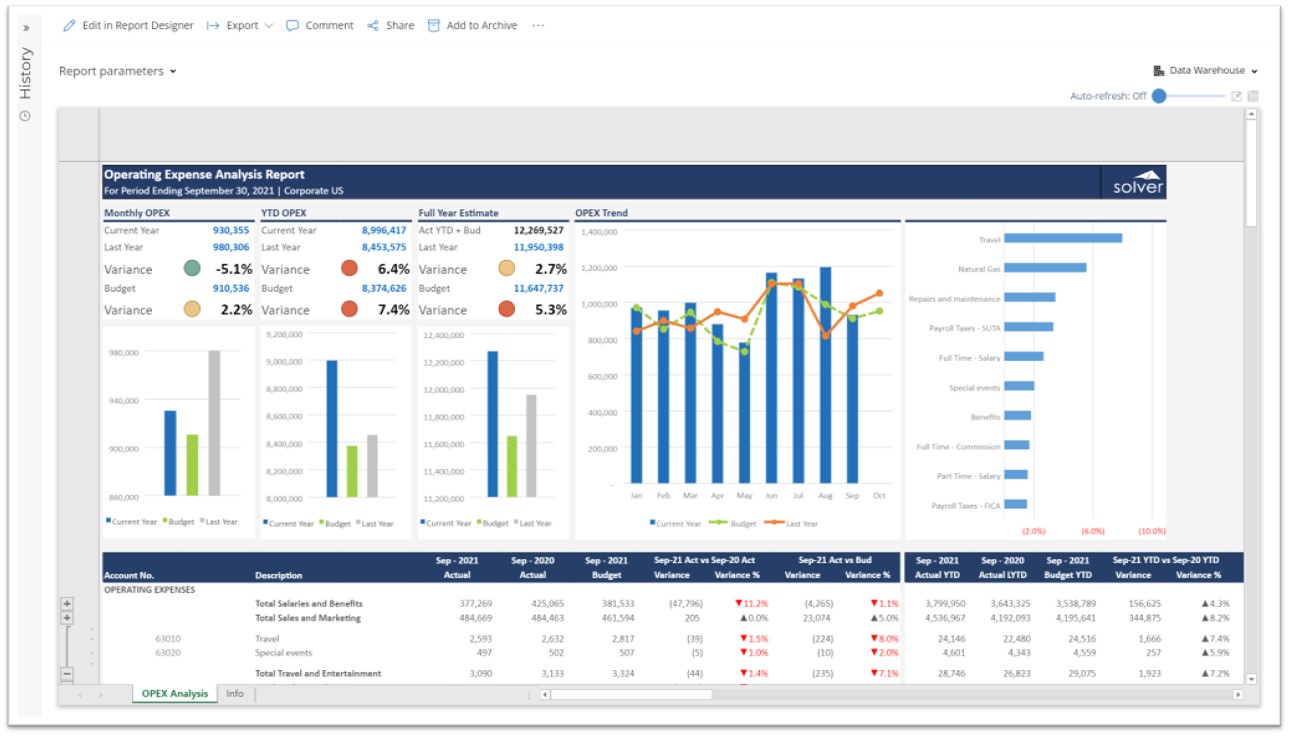
Operating Expense Dashboard for SaaS Companies using Dynamics 365 Business Central
This article describes the Operating Expense Dashboard that is included with Solver's SaaS model ...
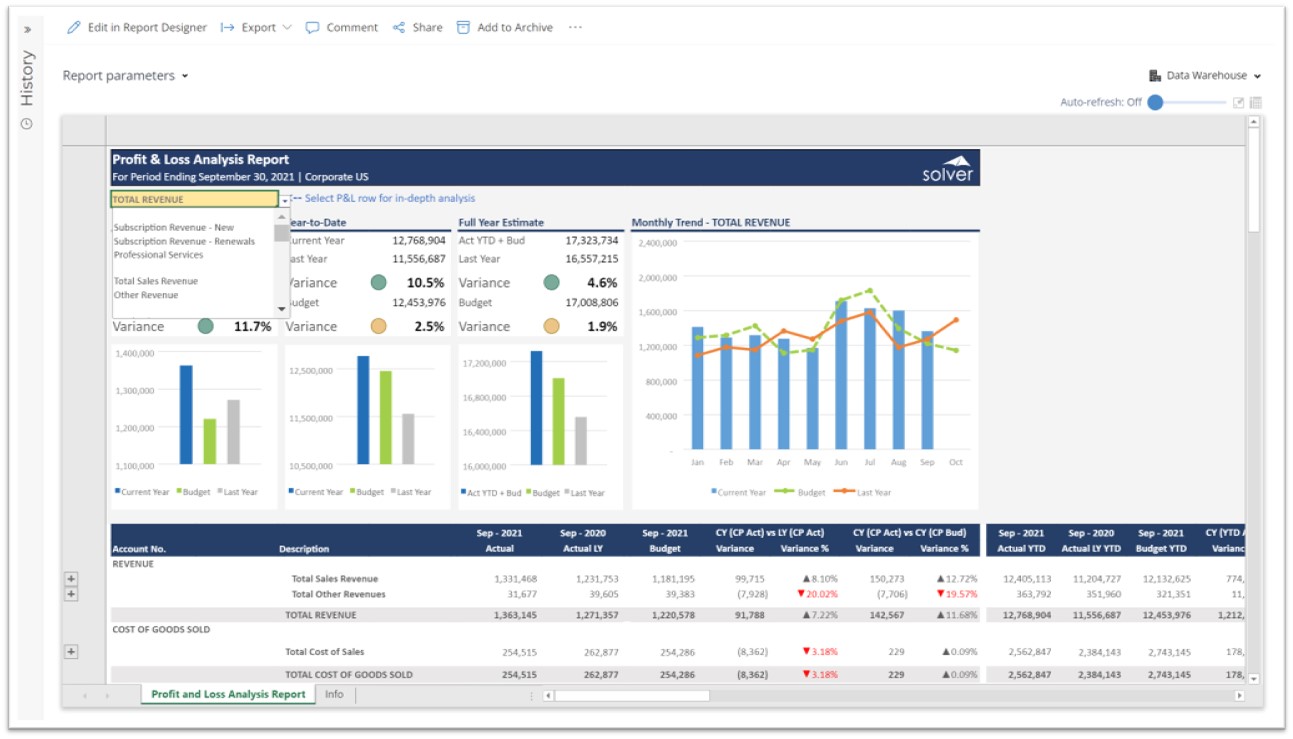
Profit & Loss Interactive Report for SaaS Companies using Dynamics 365 Business Central
This article describes the Profit & Loss Interactive Report that is included with Solver's SaaS ...
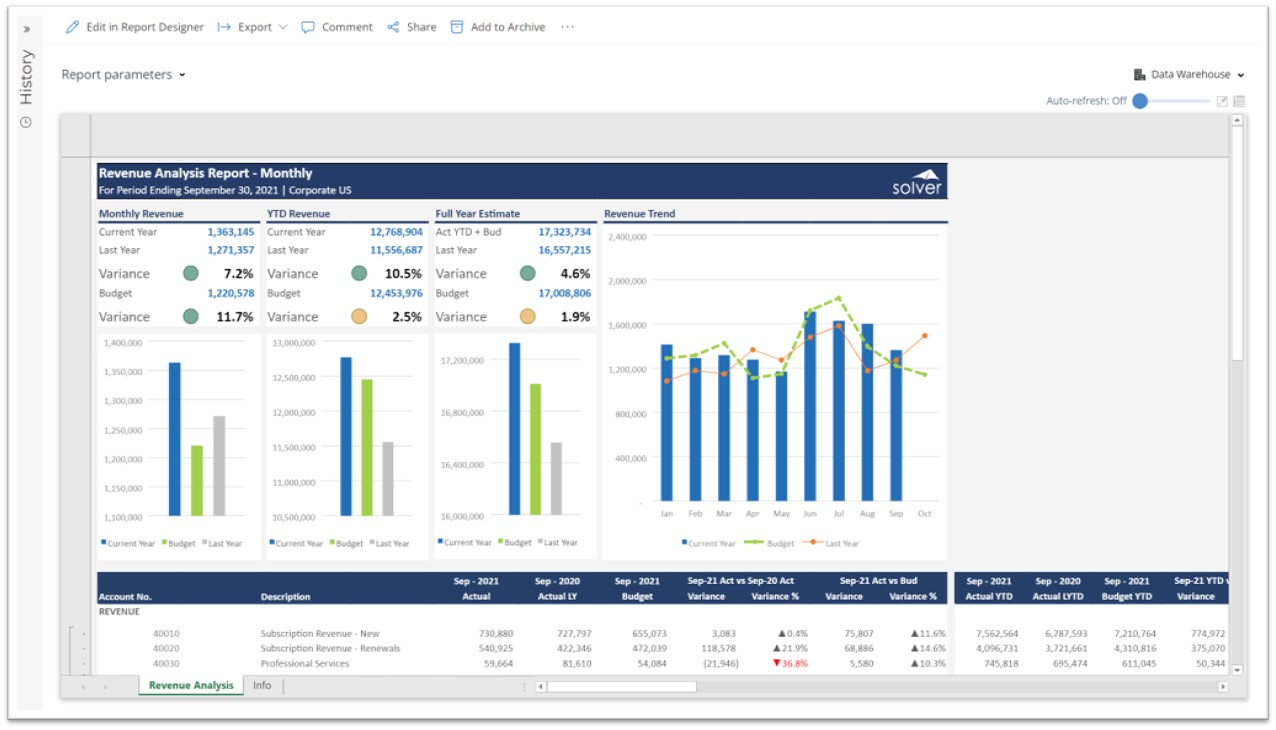
Revenue Variance and Trend Dashboard for SaaS Companies using Dynamics 365 Business Central
This article describes the Revenue Variance and Trend Dashboard that is included with Solver's SaaS ...
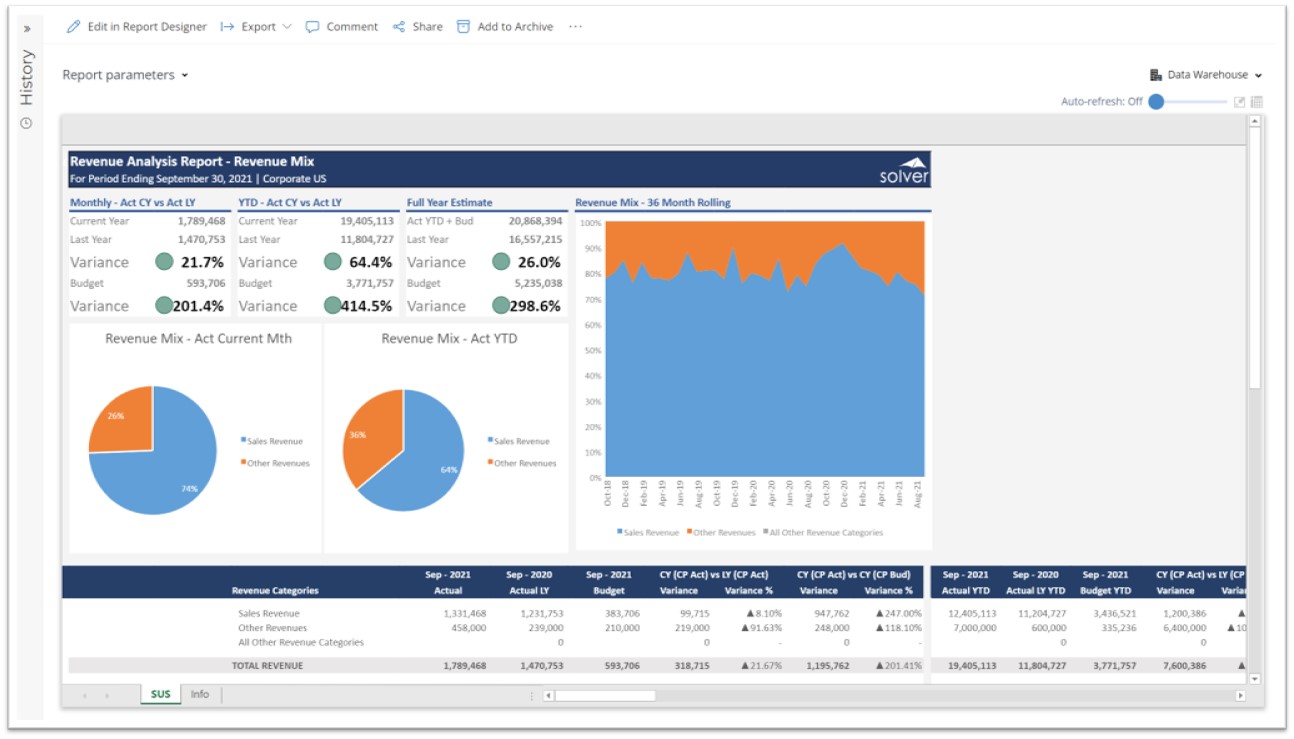
Revenue Mix Analysis Report for SaaS Companies using Dynamics 365 Business Central
This article describes the Revenue Mix Analysis Report that is included with Solver's SaaS model ...
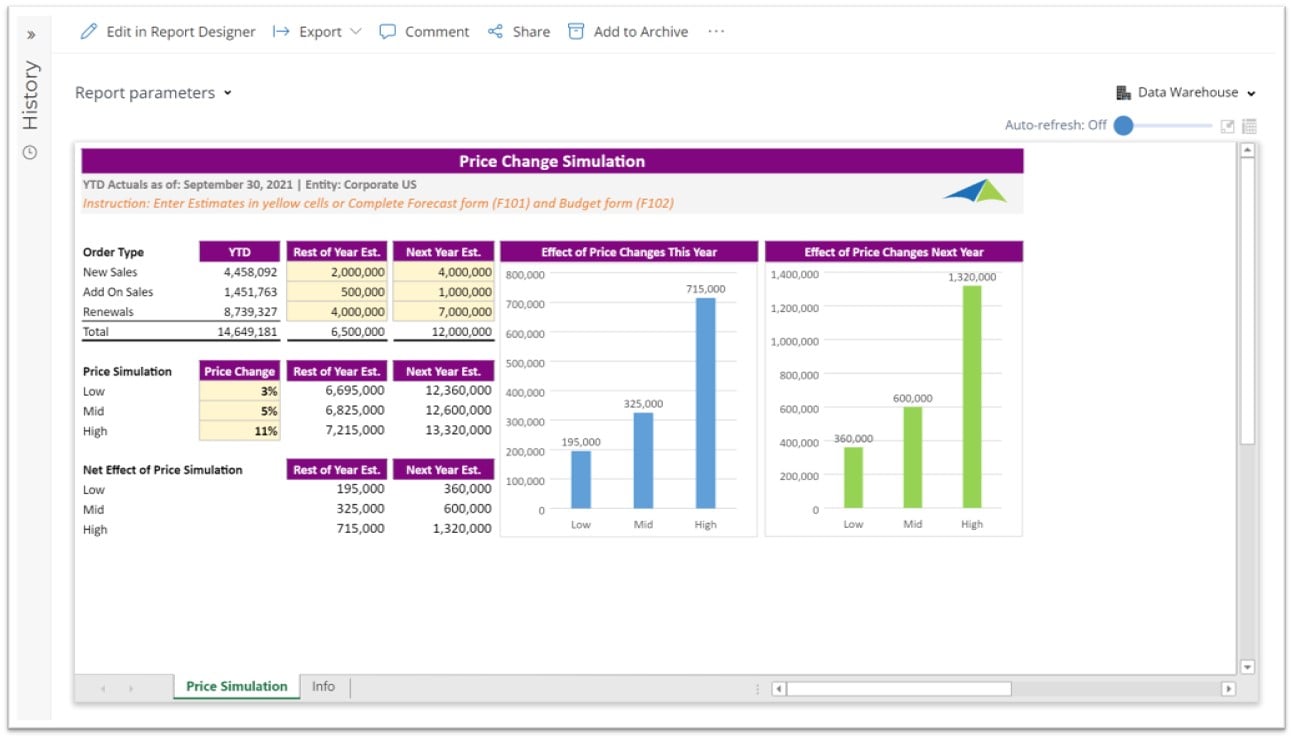
Price Change Simulation Dashboard for SaaS Companies using Dynamics 365 Business Central
This article describes the Price Change Simulation Dashboard that is included with Solver's SaaS ...
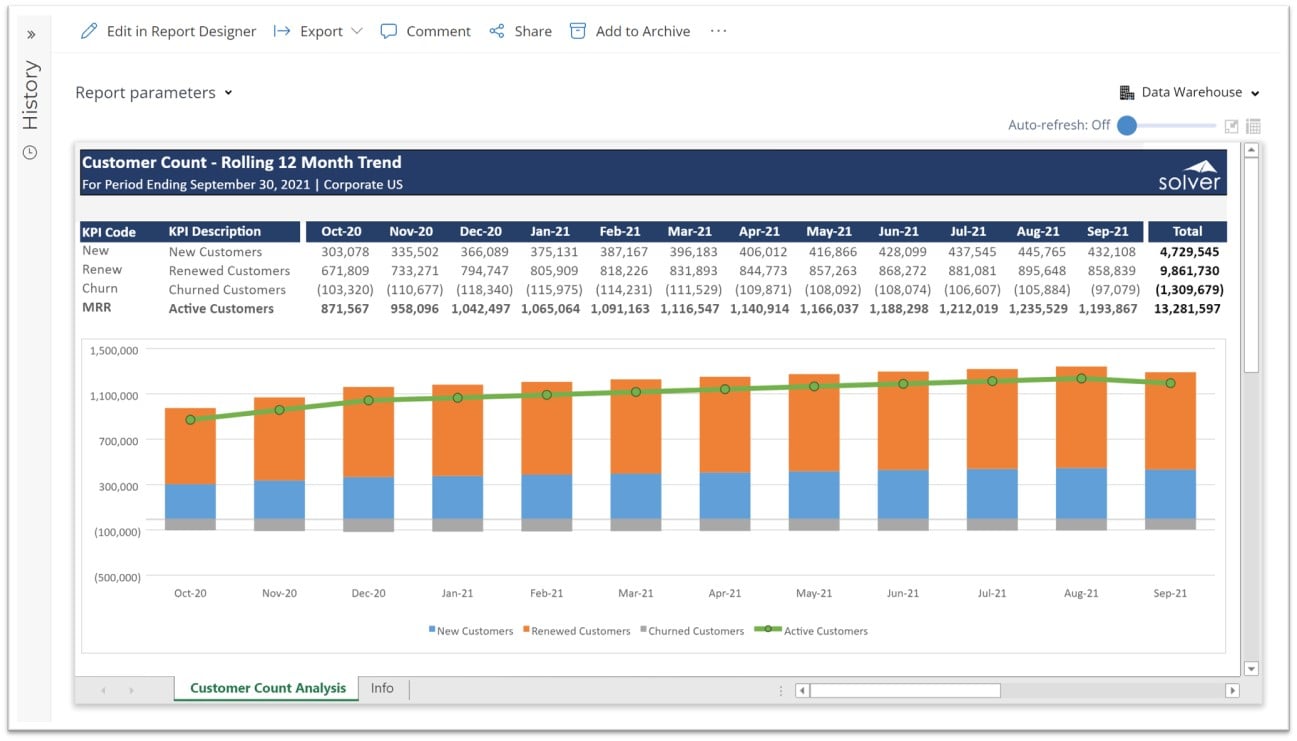
Rolling 12 Month Customer Count Trend Report for SaaS Companies using Dynamics 365 Business Central
This article describes the Rolling 12 Month Customer Count Trend Report that is included with ...
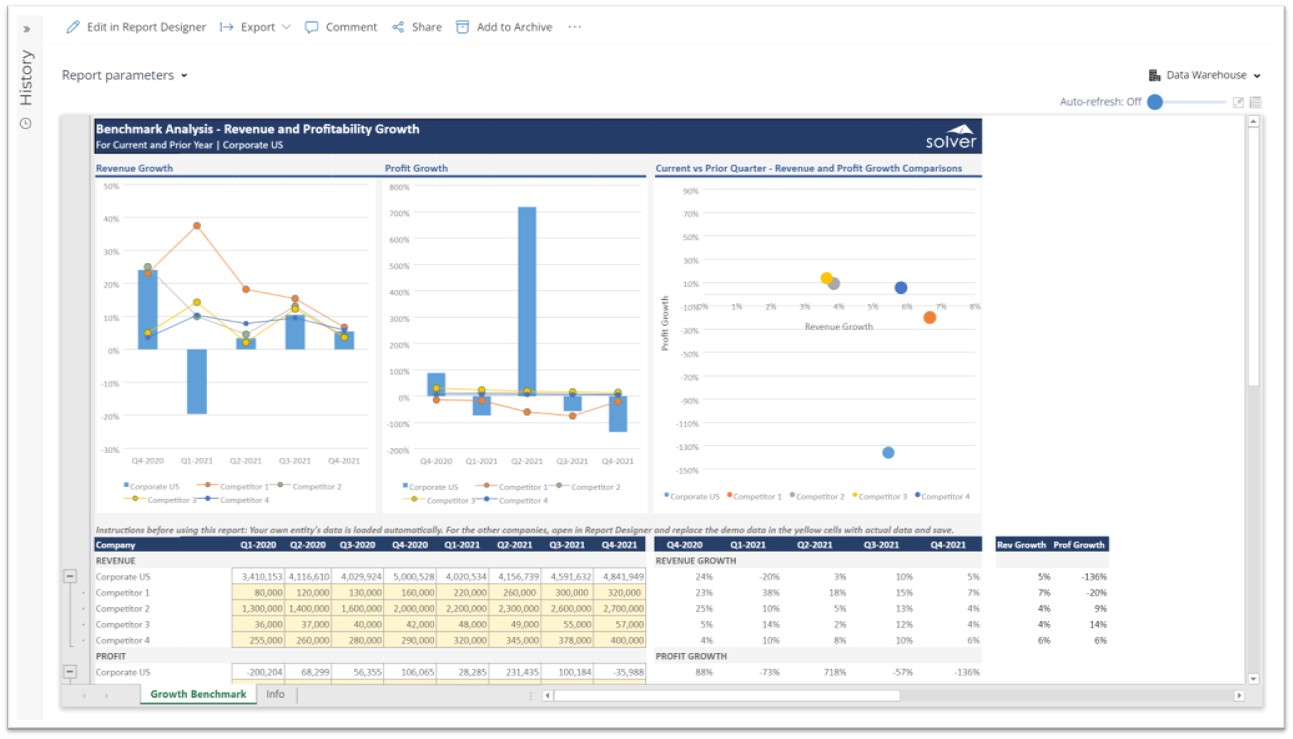
Revenue and Profitability Benchmark Report for SaaS Companies using Dynamics 365 Business Central
This article describes the Revenue and Profitability Benchmark Report that is included with ...
Why Annual Recurring Revenue (ARR) is a Key Metric for SaaS Companies
SaaS (Software as a Service) companies are always looking for ways to measure and track their ...
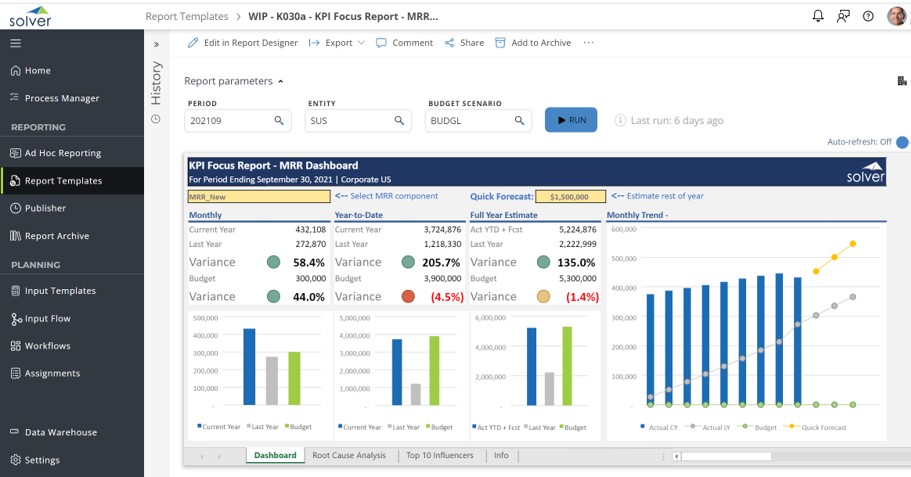
Why Monthly Recurring Revenue (MRR) is a Must-Track KPI for SaaS Companies
SaaS (Software as a Service) companies are constantly looking for ways to measure and track their ...
Using Gross Margin Trend Analysis Reports to Streamline the Monthly Reporting Process
How can Profitability Analysis Drive Faster and Better Decisions? As CFOs increasingly become key ...
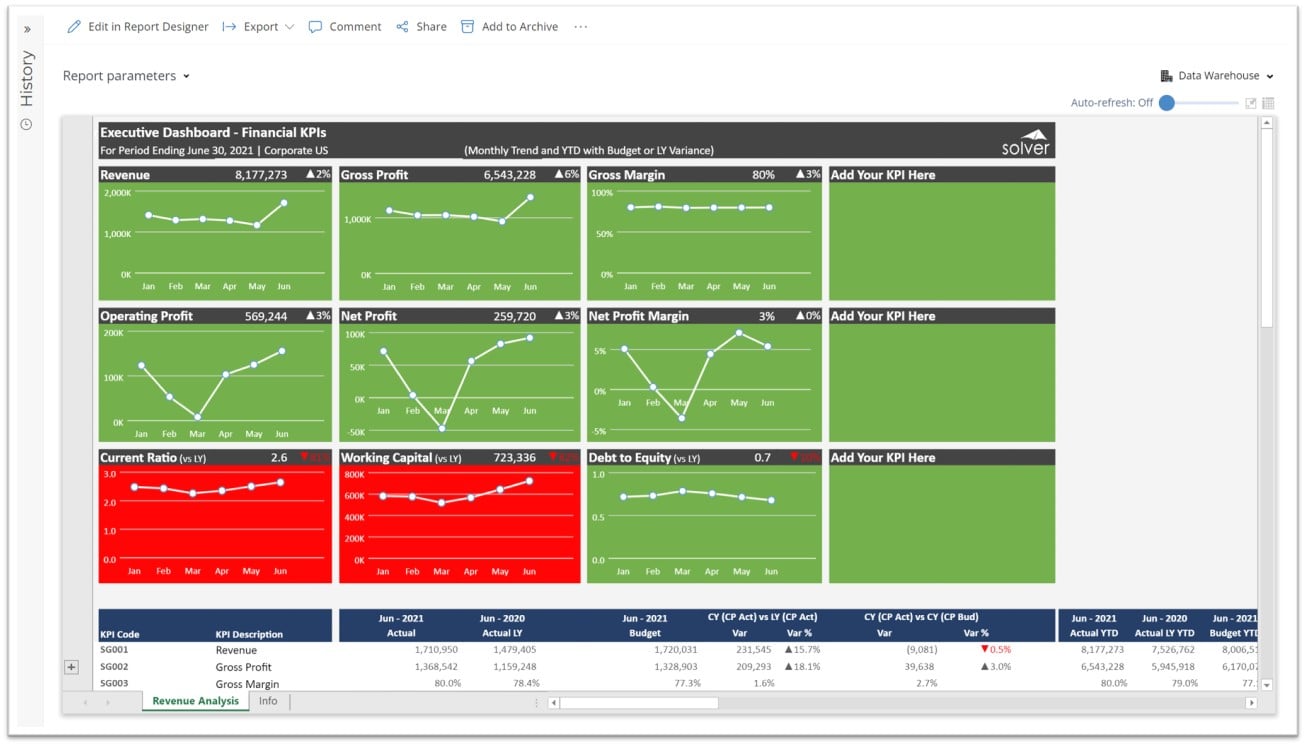
Using Executive Dashboards with Financial KPIs to Streamline the Monthly Analysis Process
How can Dashboards and Scorecards Drive Faster and Better Decisions? As CFOs increasingly become ...
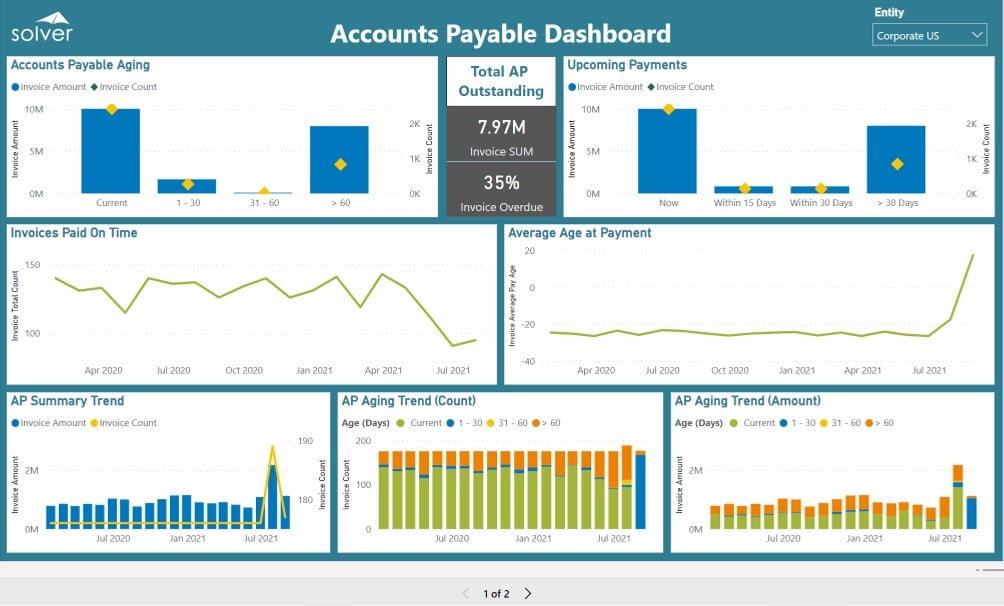
Using Accounts Payable Summary Dashboards to Streamline Processes
How can Accounts Payable ( AP) Dashboard s Drive Faster and Better Decisions? As Controllers and ...
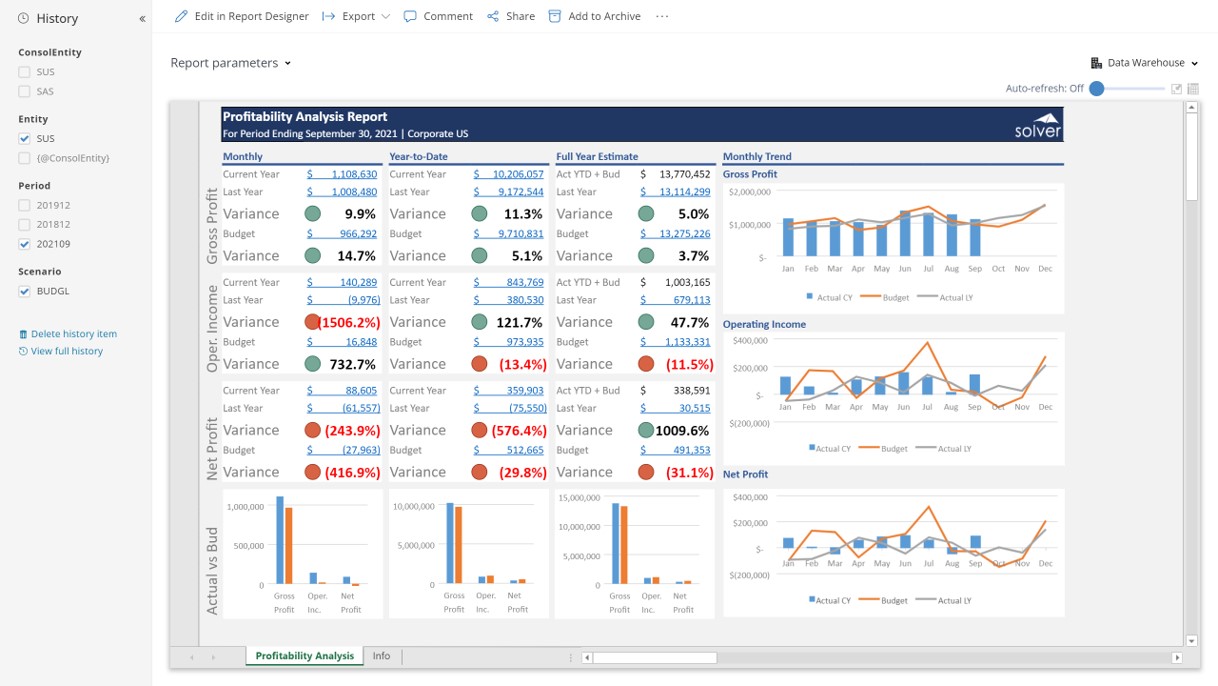
Using Profitability Analysis to Streamline the Monthly Reporting Process
How can Gross Profit and Net Profit Analysis Reports Drive Faster and Better Decisions? As CFOs ...
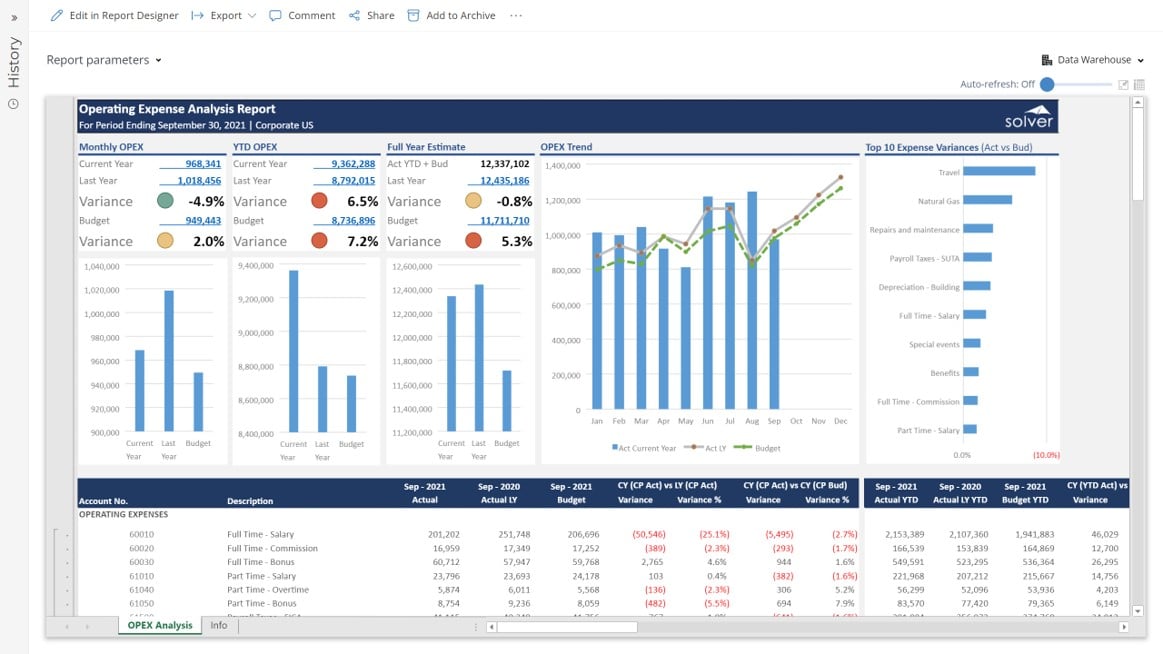
Using Operating Expense Analysis to Streamline the Monthly Reporting and Analysis Process
How can Operating Expense Analysis Report s Drive Faster and Better Decisions? As Controllers ...
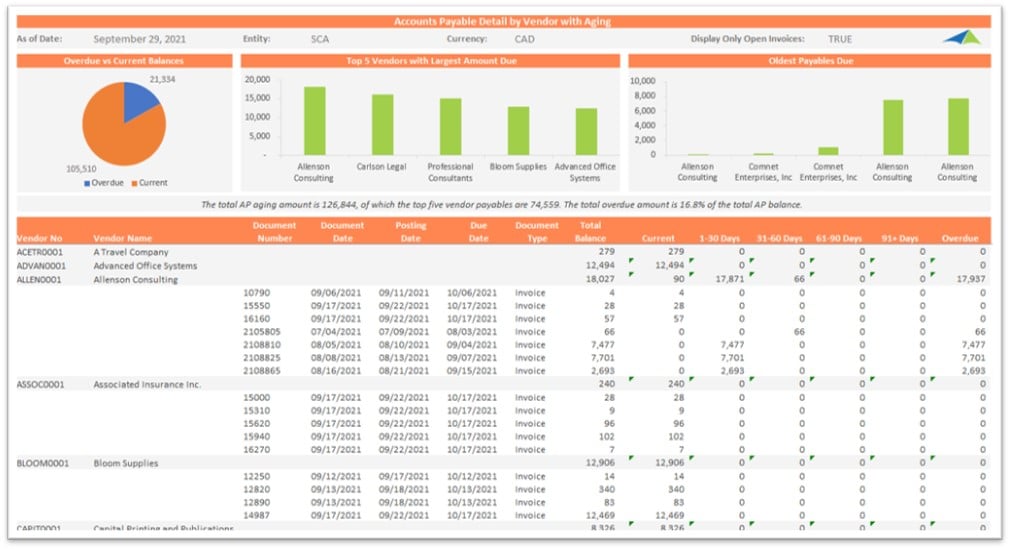
Using AP Detail by Vendor Reports to Streamline the Expense Analysis Process
How can Accounts Payable Reports Drive Faster and Better Decisions? As Accounting Managers ...
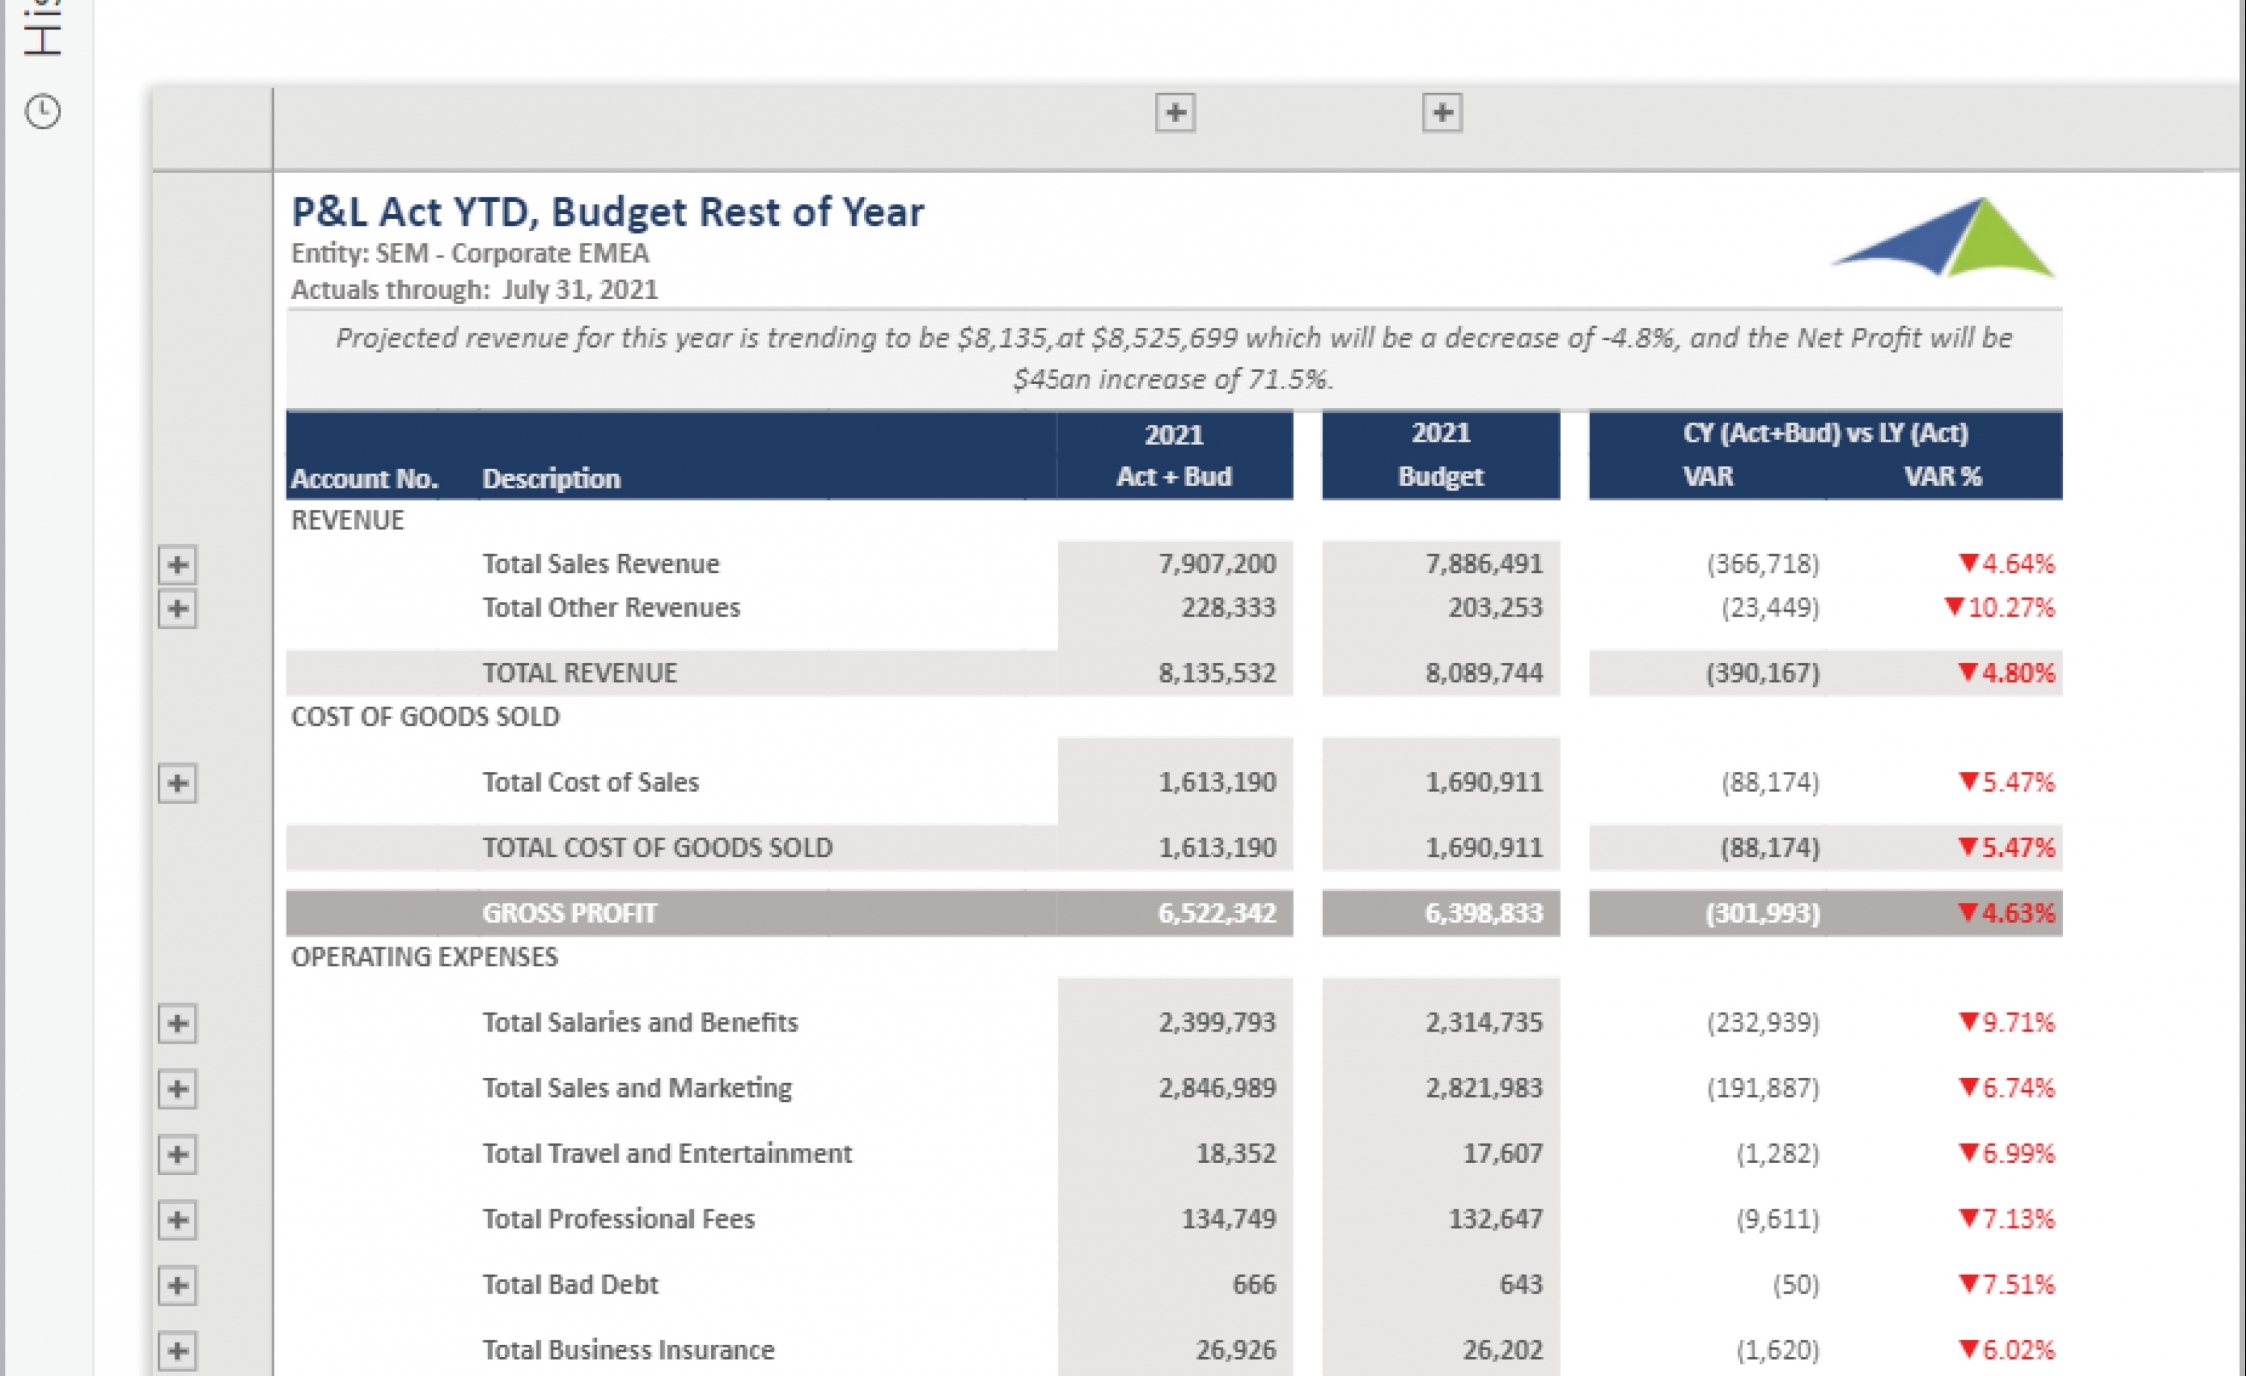
Using a P&L Report with Automated Full Year Estimates to Streamline the Monthly Reporting Process
How can Financial Statement s Drive Faster and Better Decisions? As CFOs increasingly become key ...
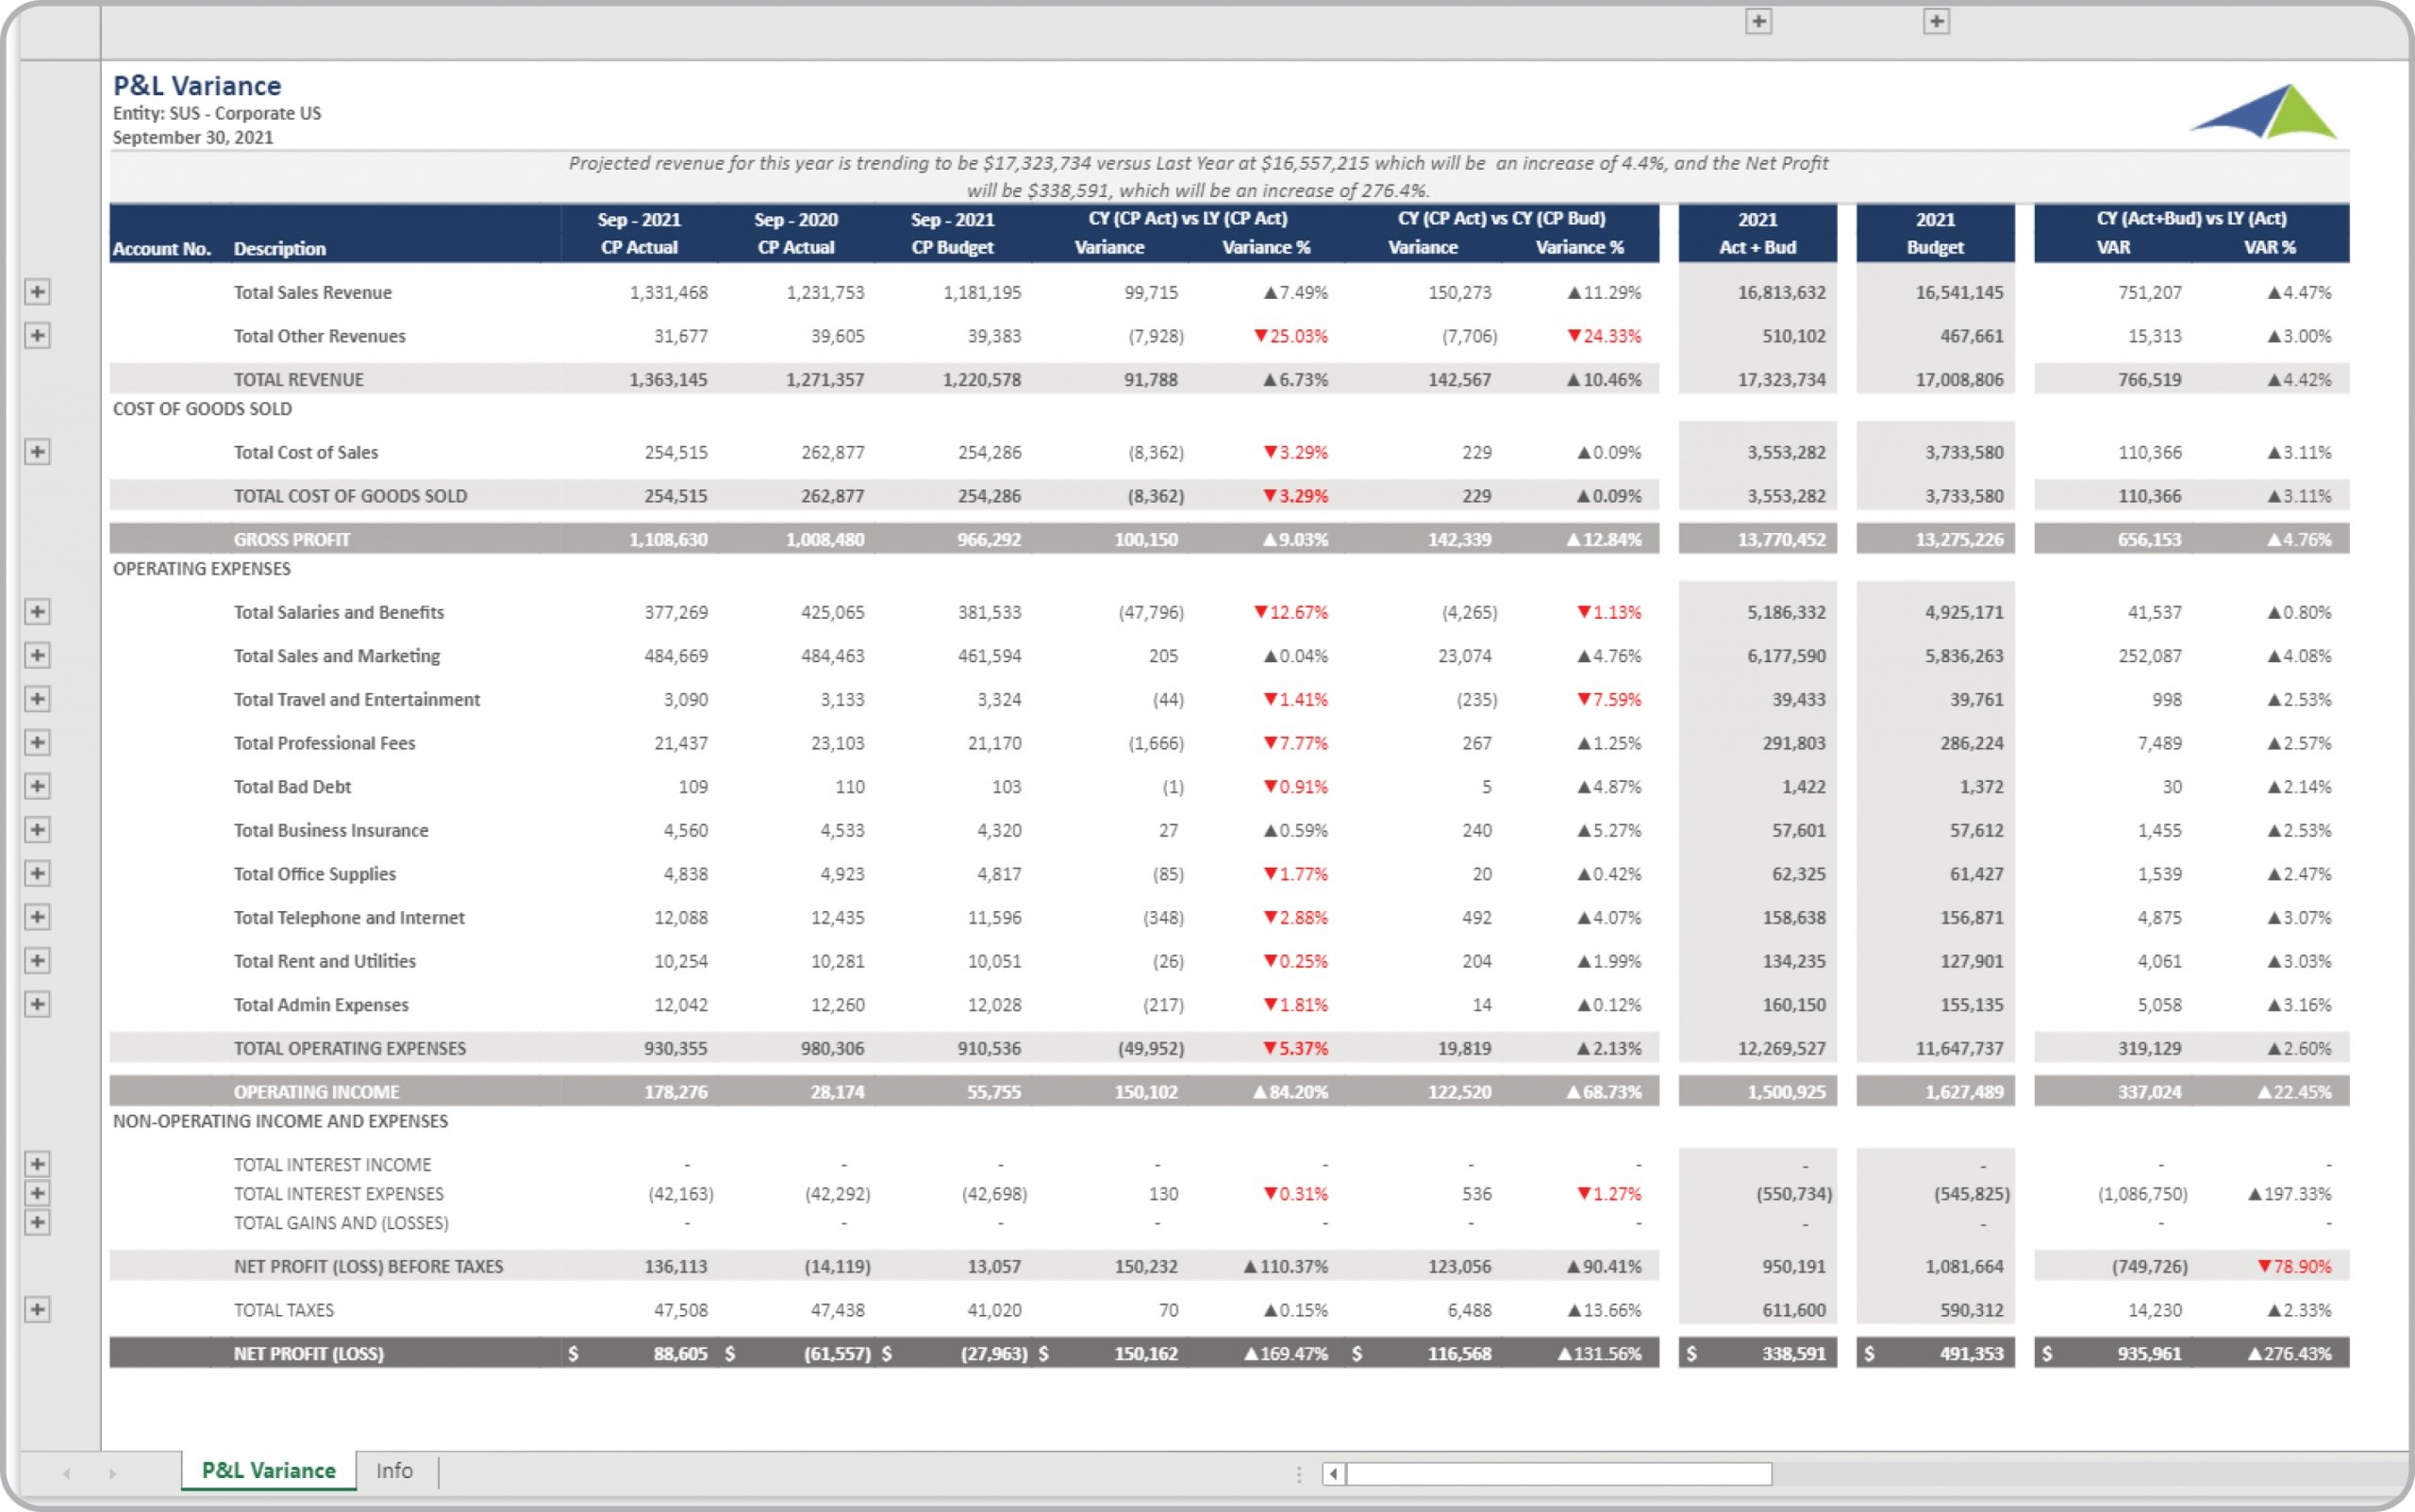
Using Profit & Loss Variance Reports to Streamline the Monthly Reporting Process
How can Financial Statements Drive Faster and Better Decisions? As Corporate Controllers ...
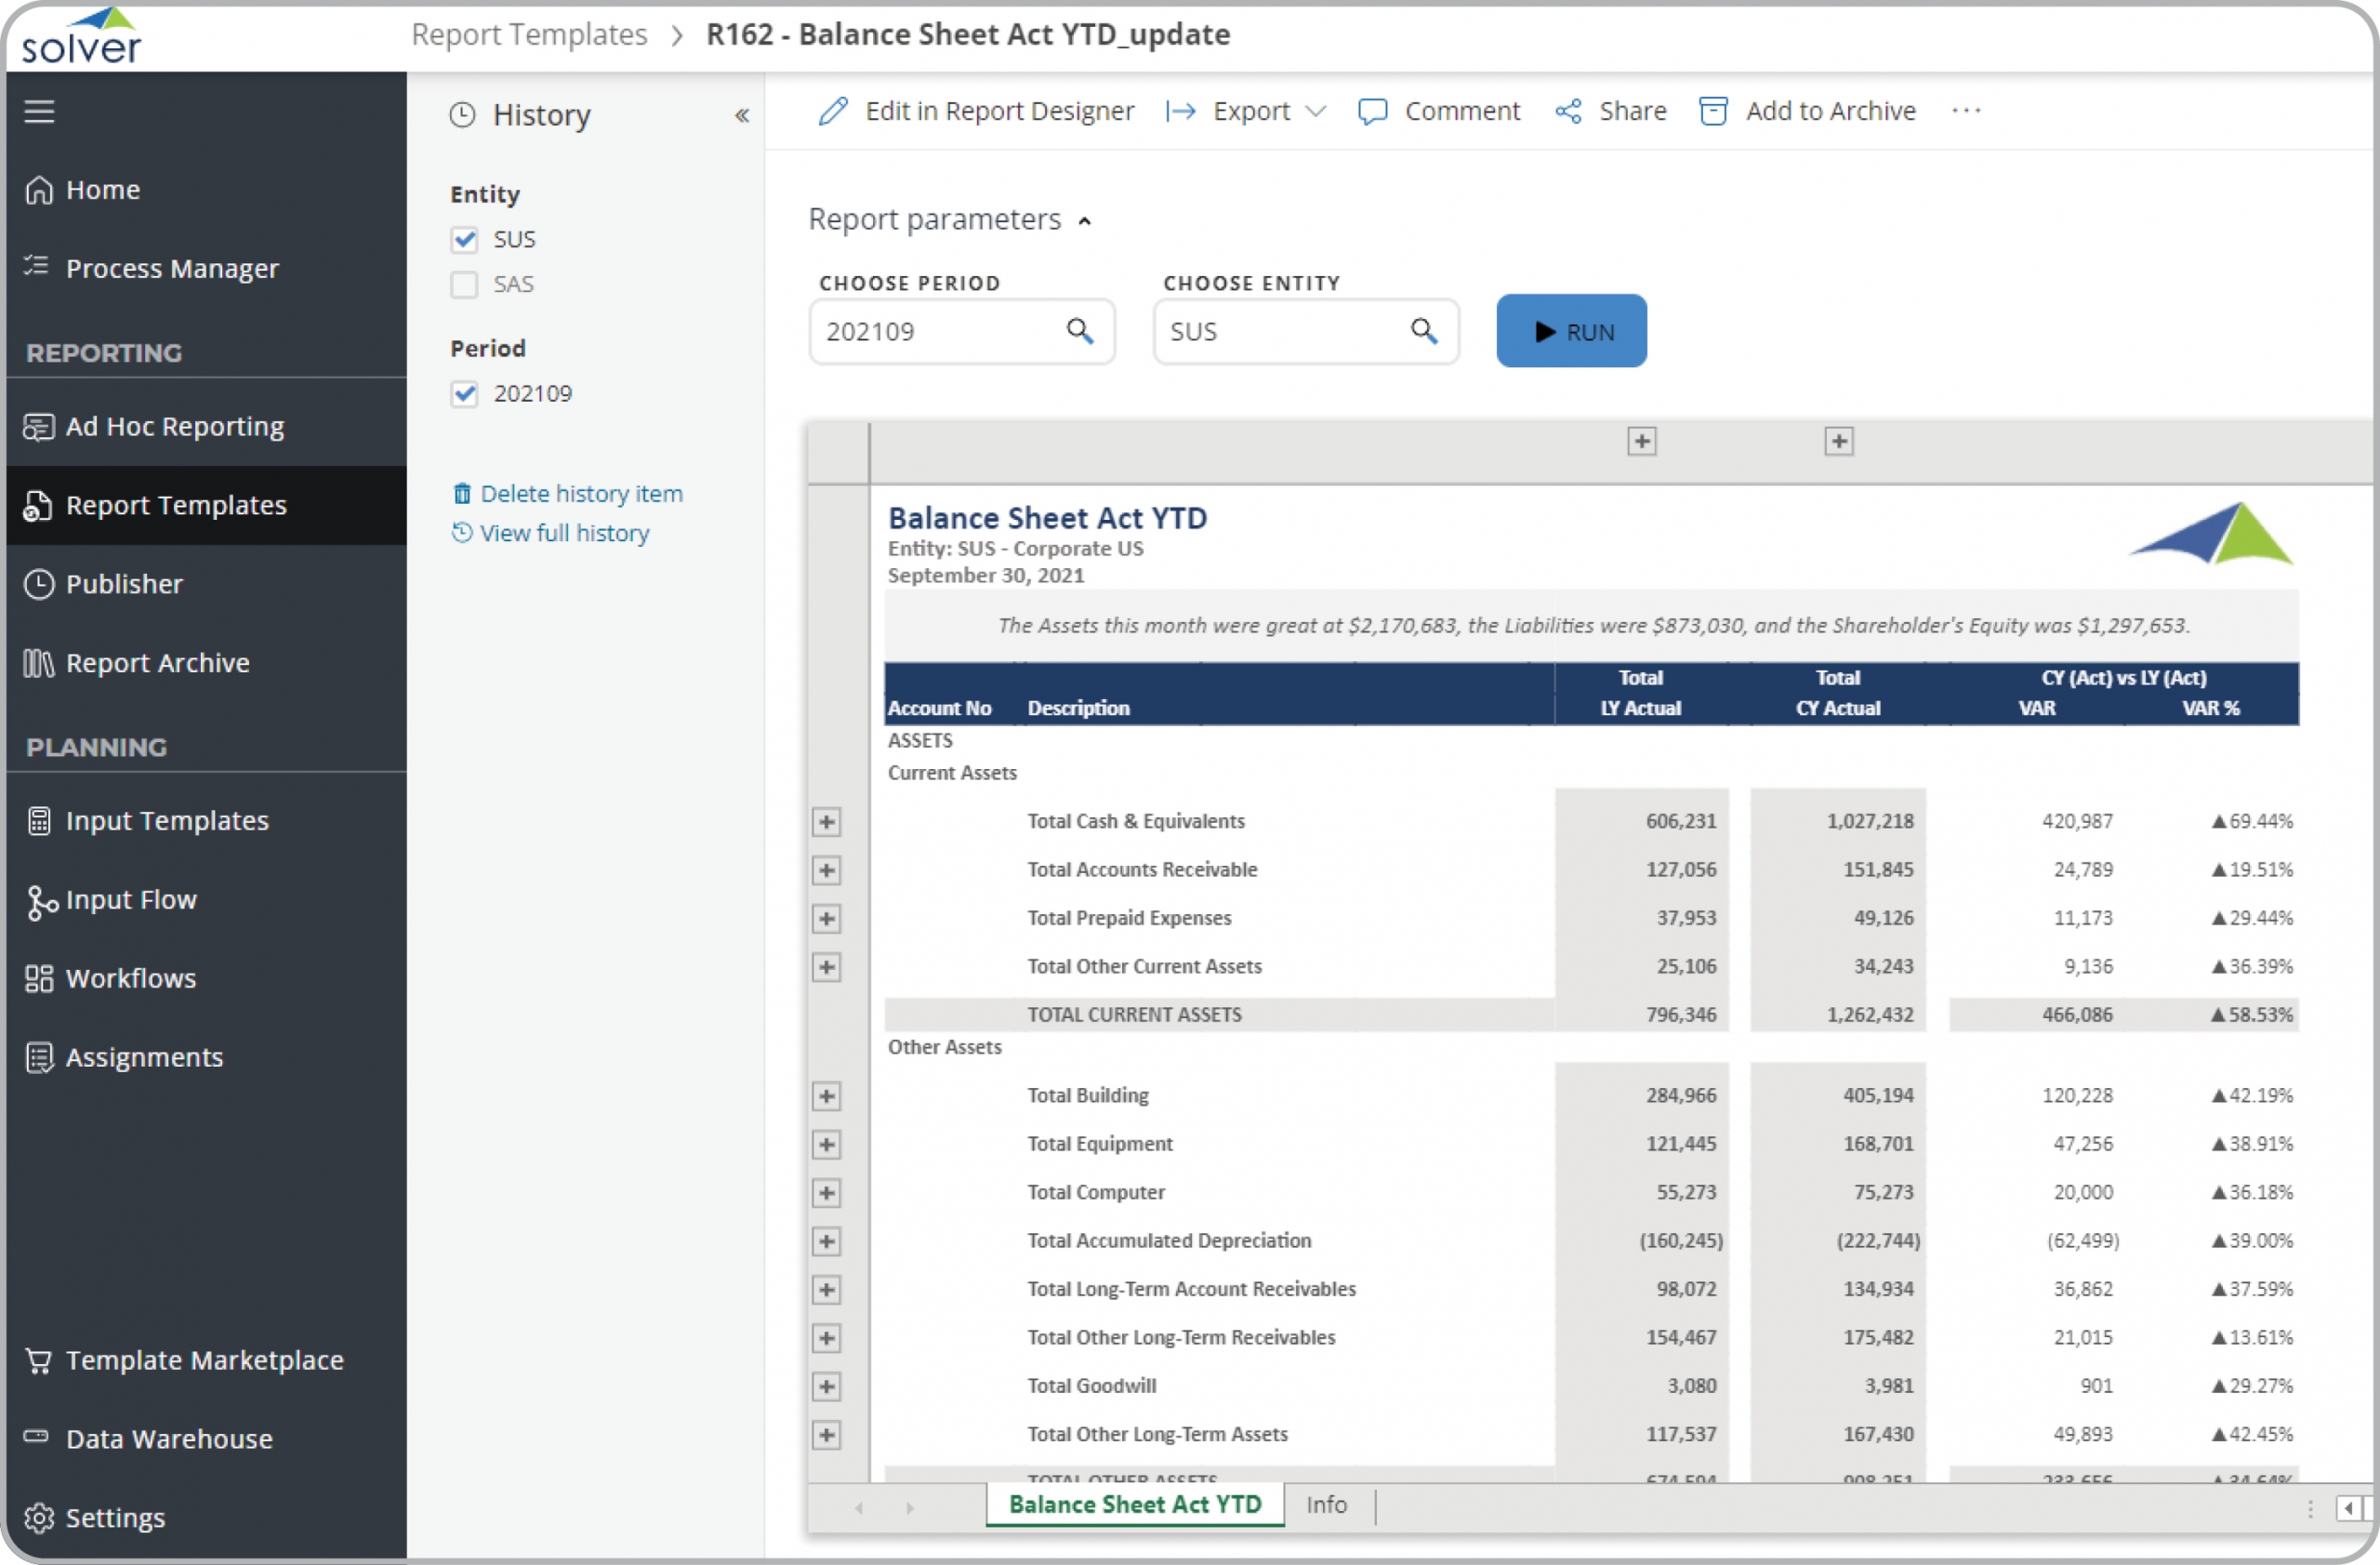
Using the Balance Sheet with Last Year Variances Report to Streamline the Monthly Reporting Process
How can Financial Statements Drive Faster and Better Decisions? As Controllers increasingly become ...
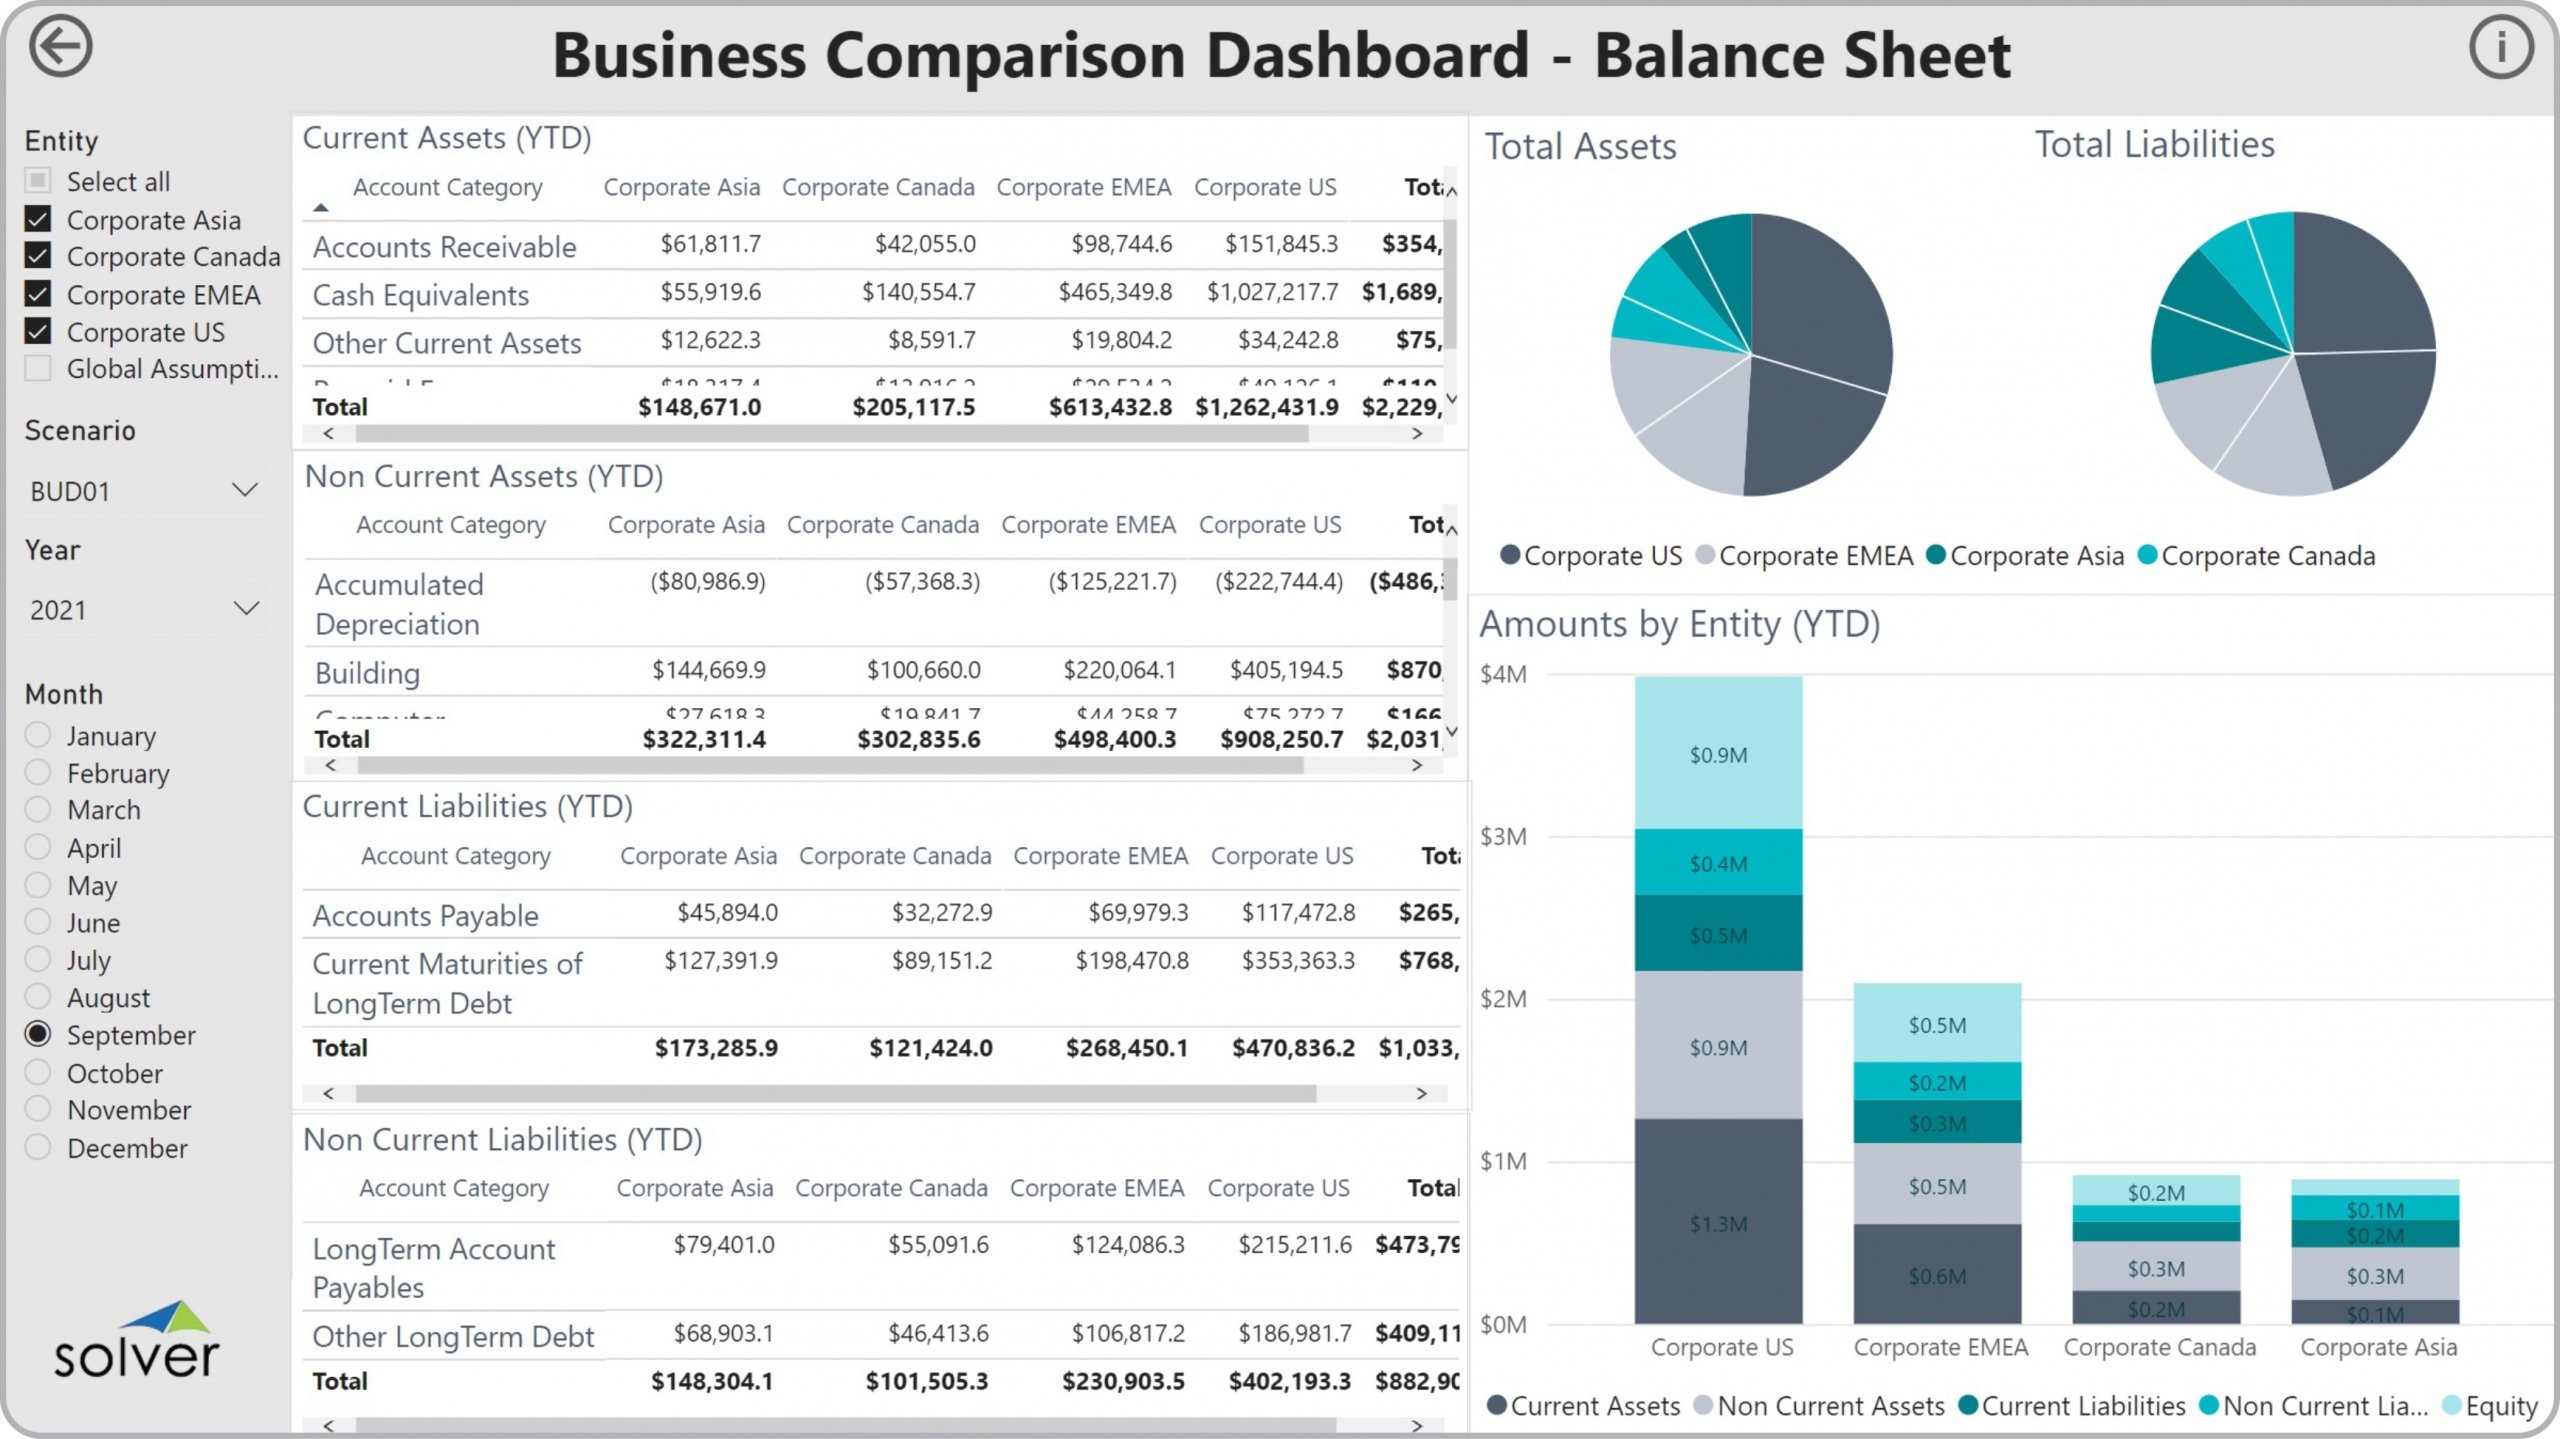
Using Balance Sheet Comparison Dashboards to Streamline the Monthly Reporting Process
How can Financial Dashboard s Drive Faster and Better Decisions? As CFOs increasingly become key ...
How to Create a Successful Demand Plan-3
At the center of every business strategy for products and services is optimal supply chain ...
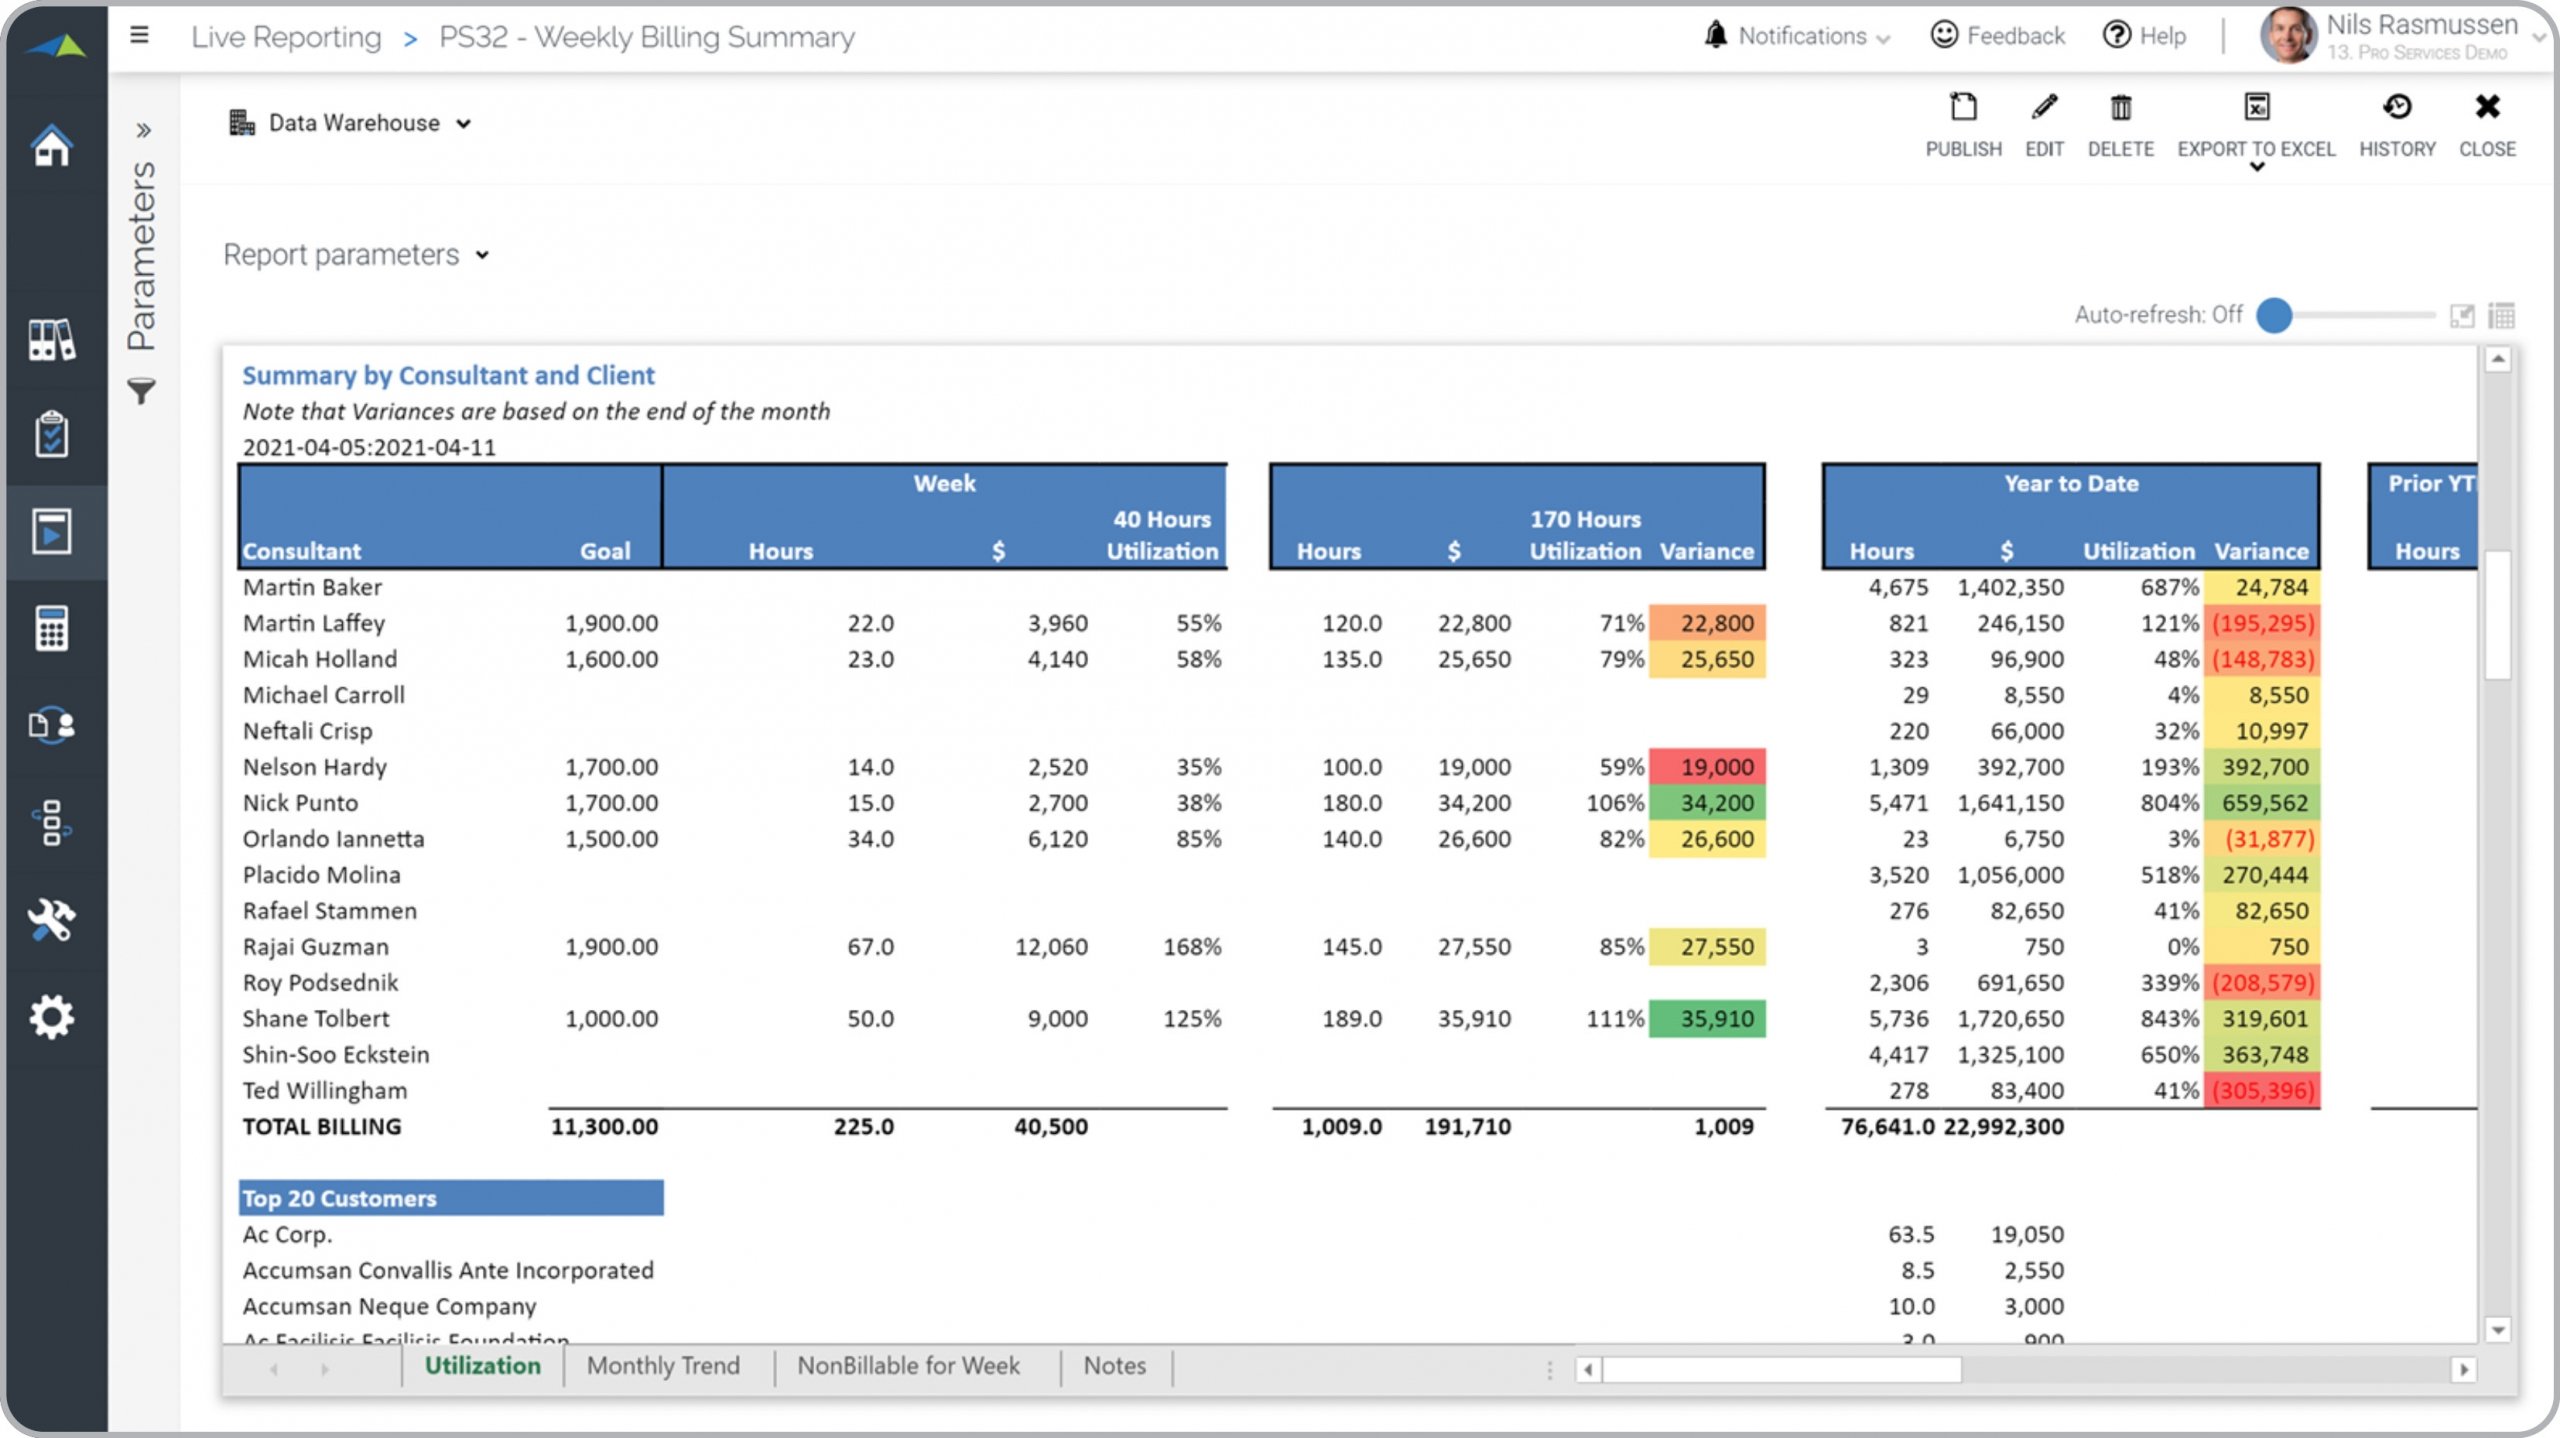
Weekly Consulting Billing and Utilization Report for Professional Services Companies
What is Weekly Consulting Billing and Utilization Report ? Consulting Utilization and Billing ...
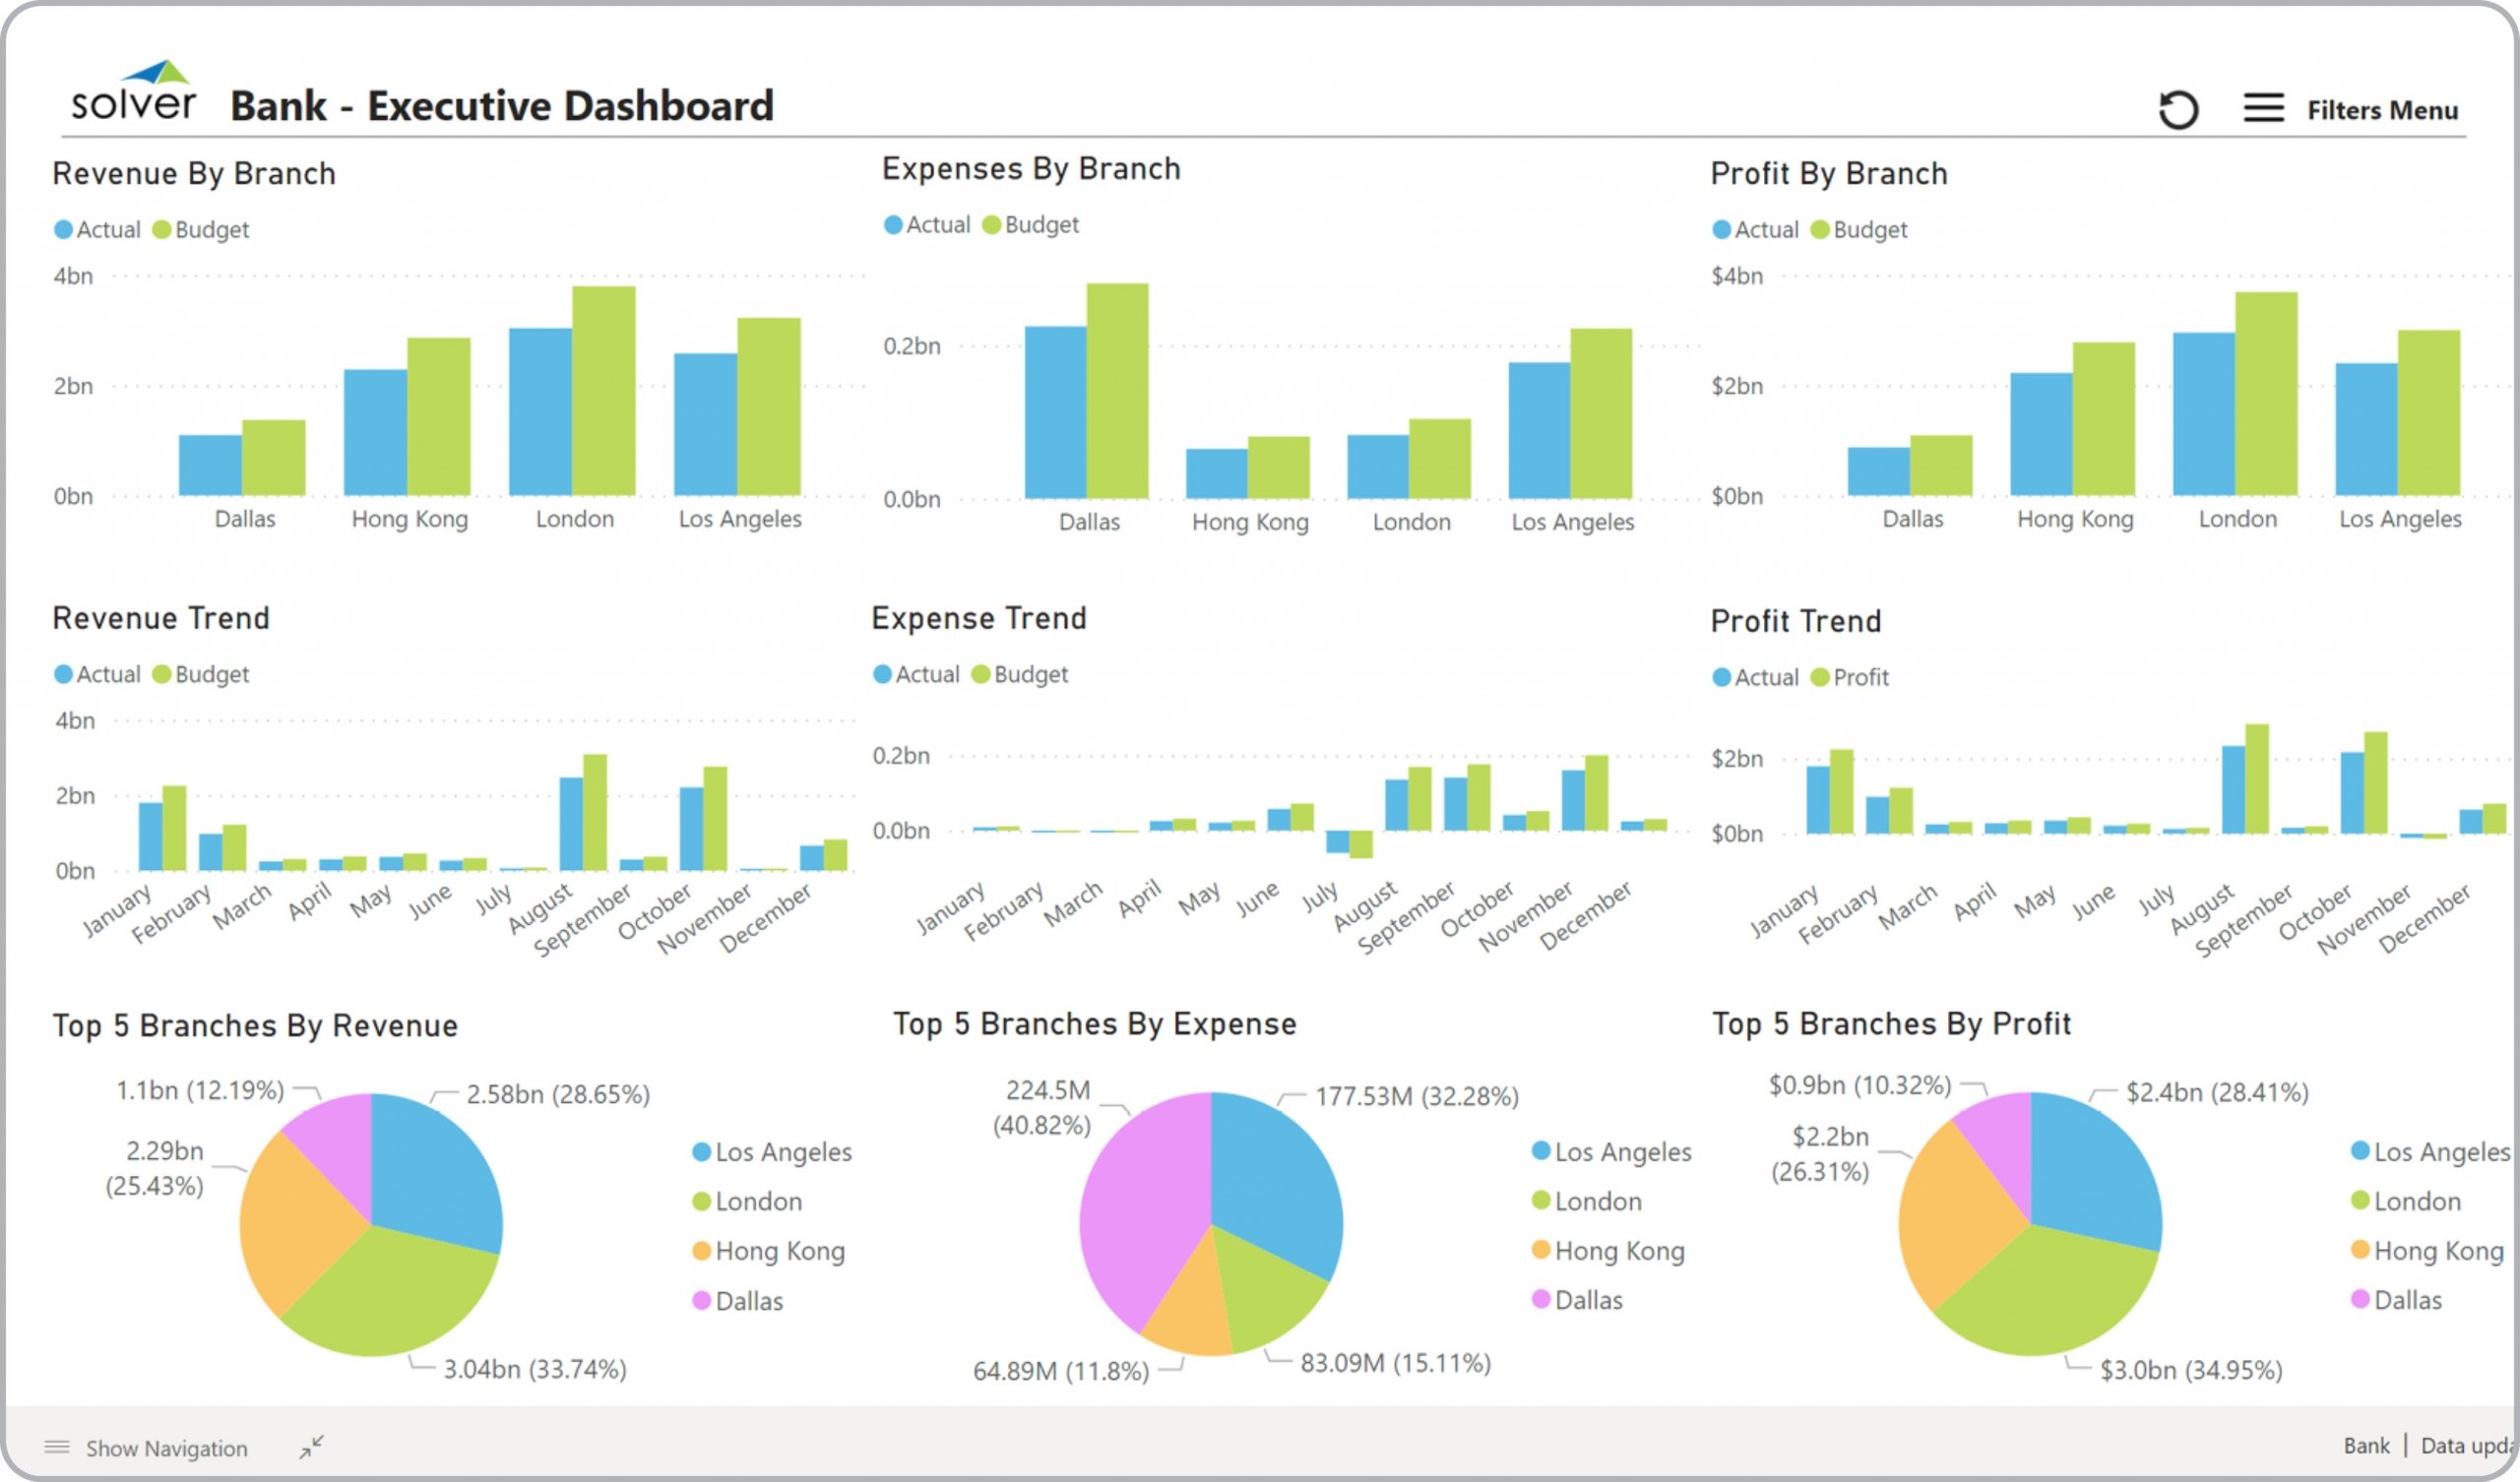
Executive Dashboard for Banks
What is an Executive Dashboard for Banks ? Executive Dashboards are considered interactive ...
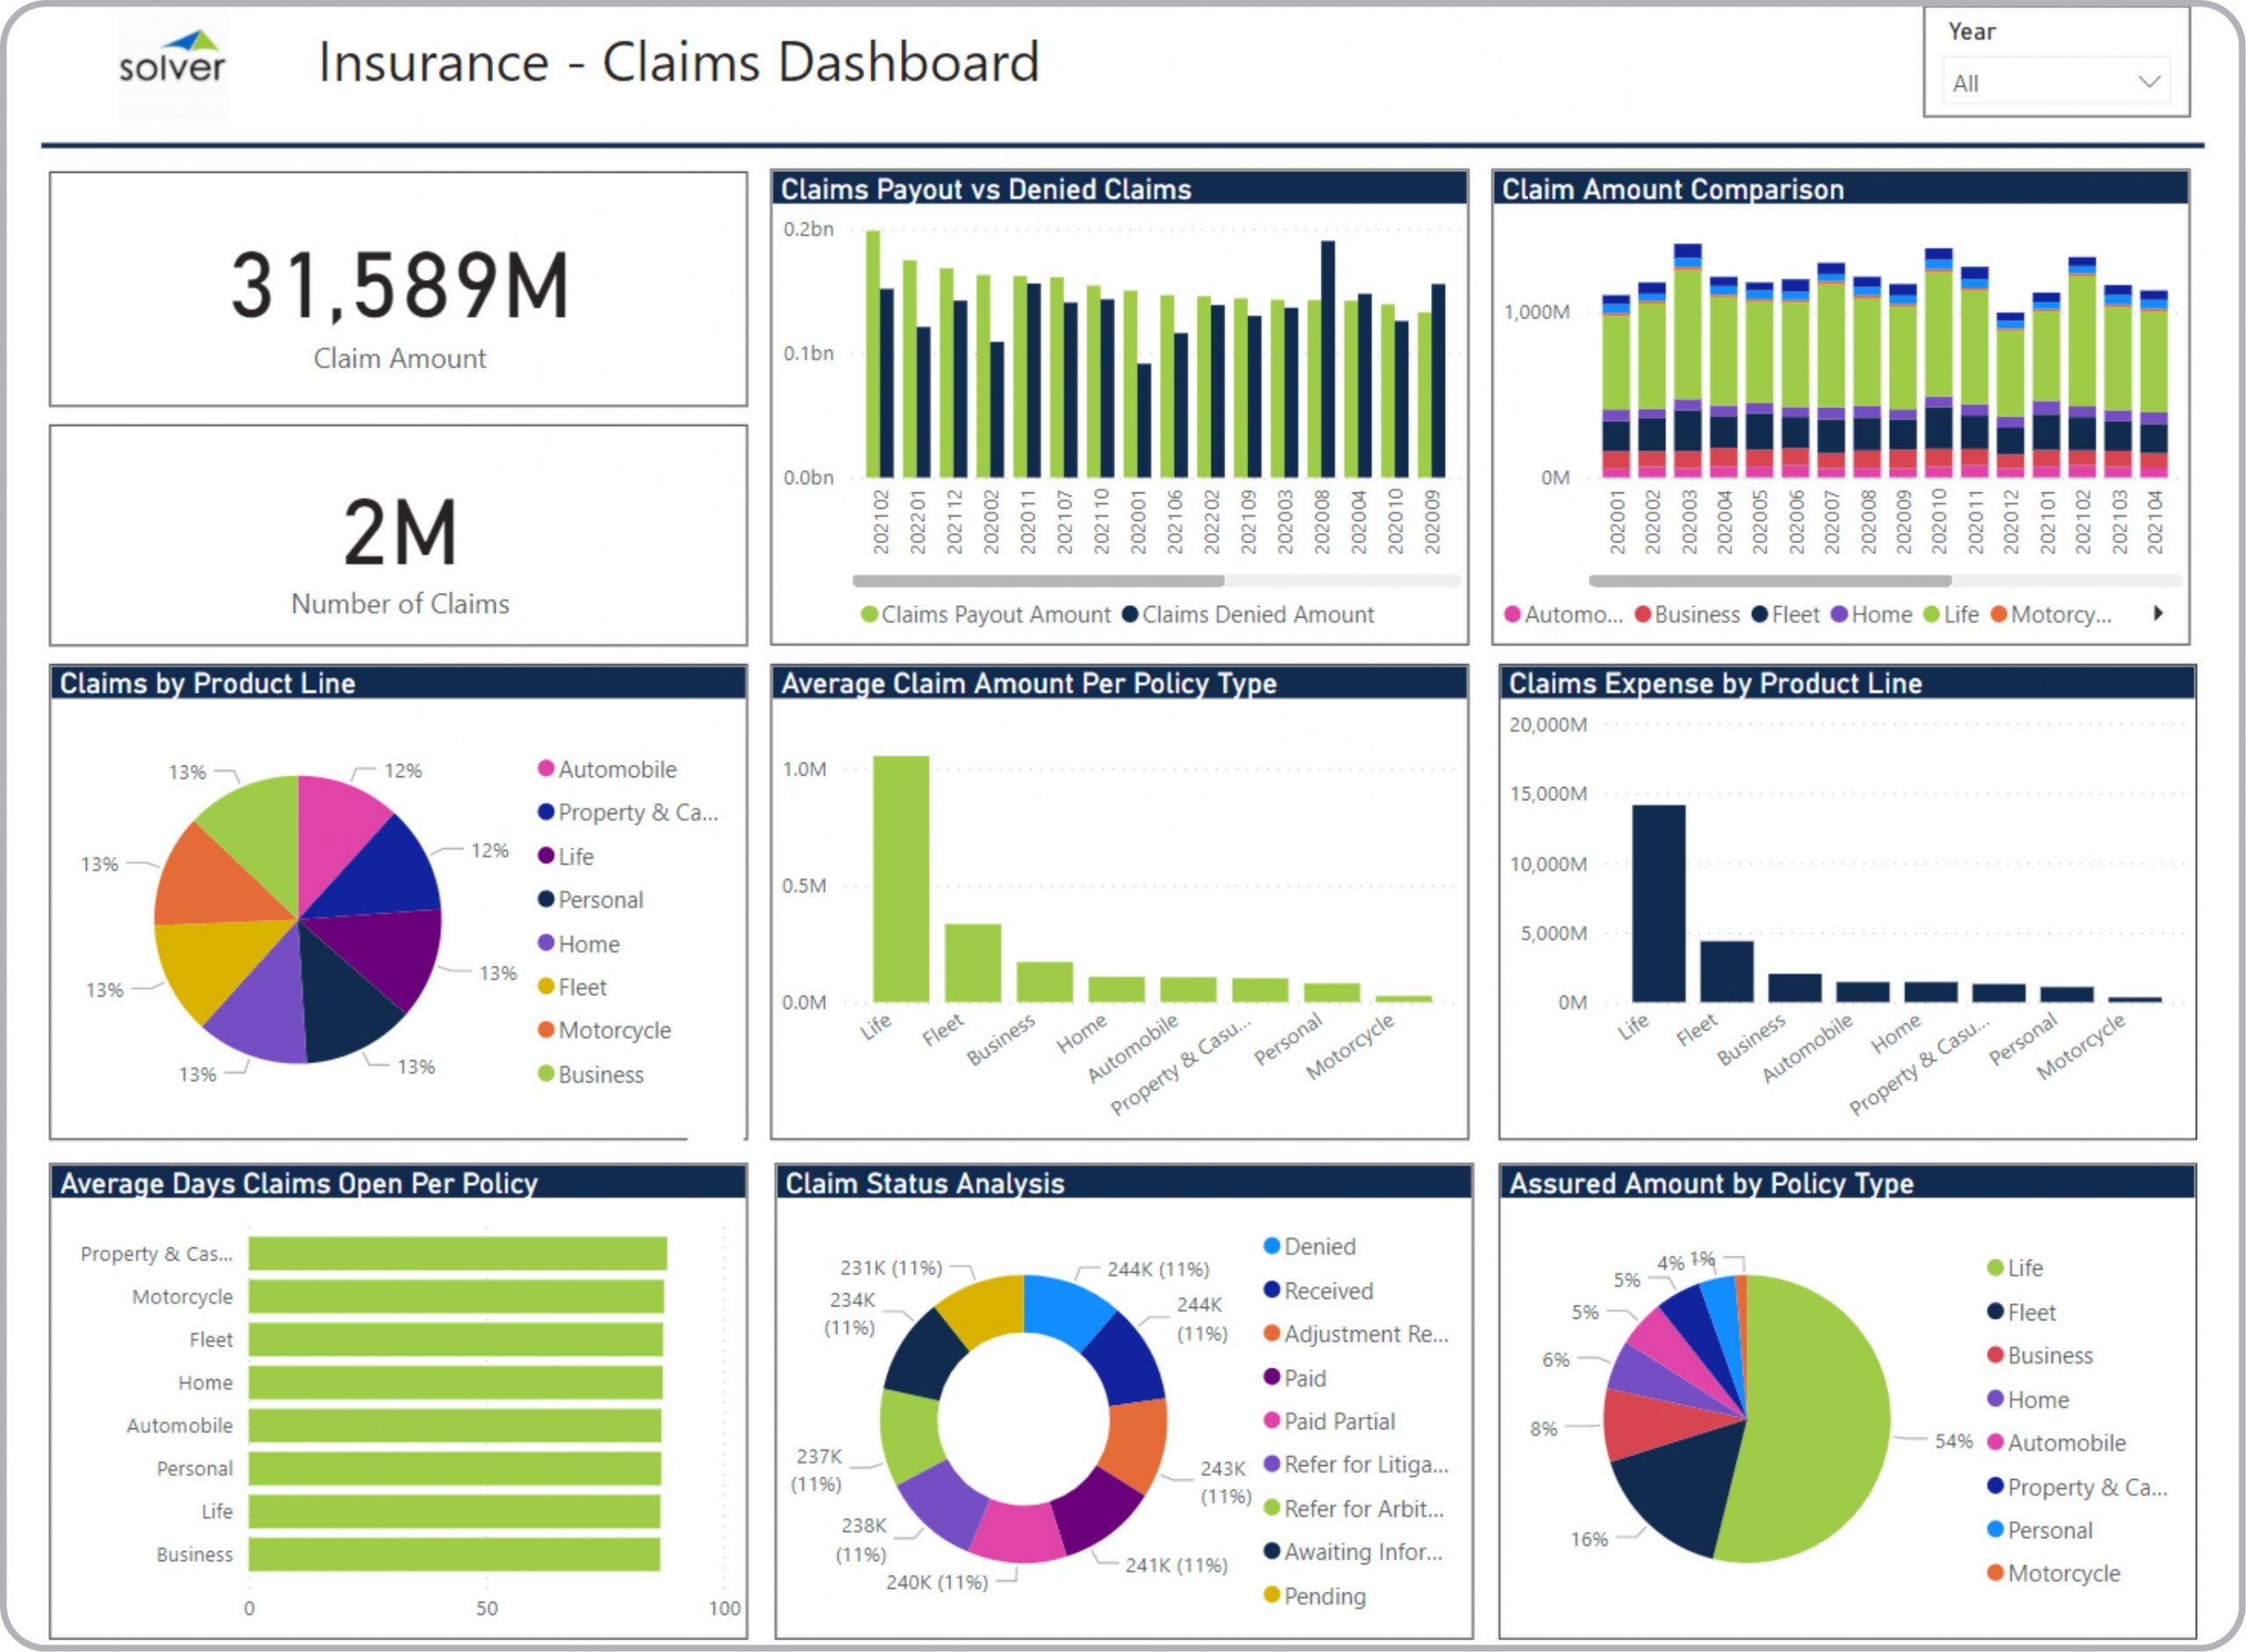
Claims Dashboard for Insurance Companies
What is a Claims Dashboard ? Claims Dashboards are considered operational analysis tools and are ...
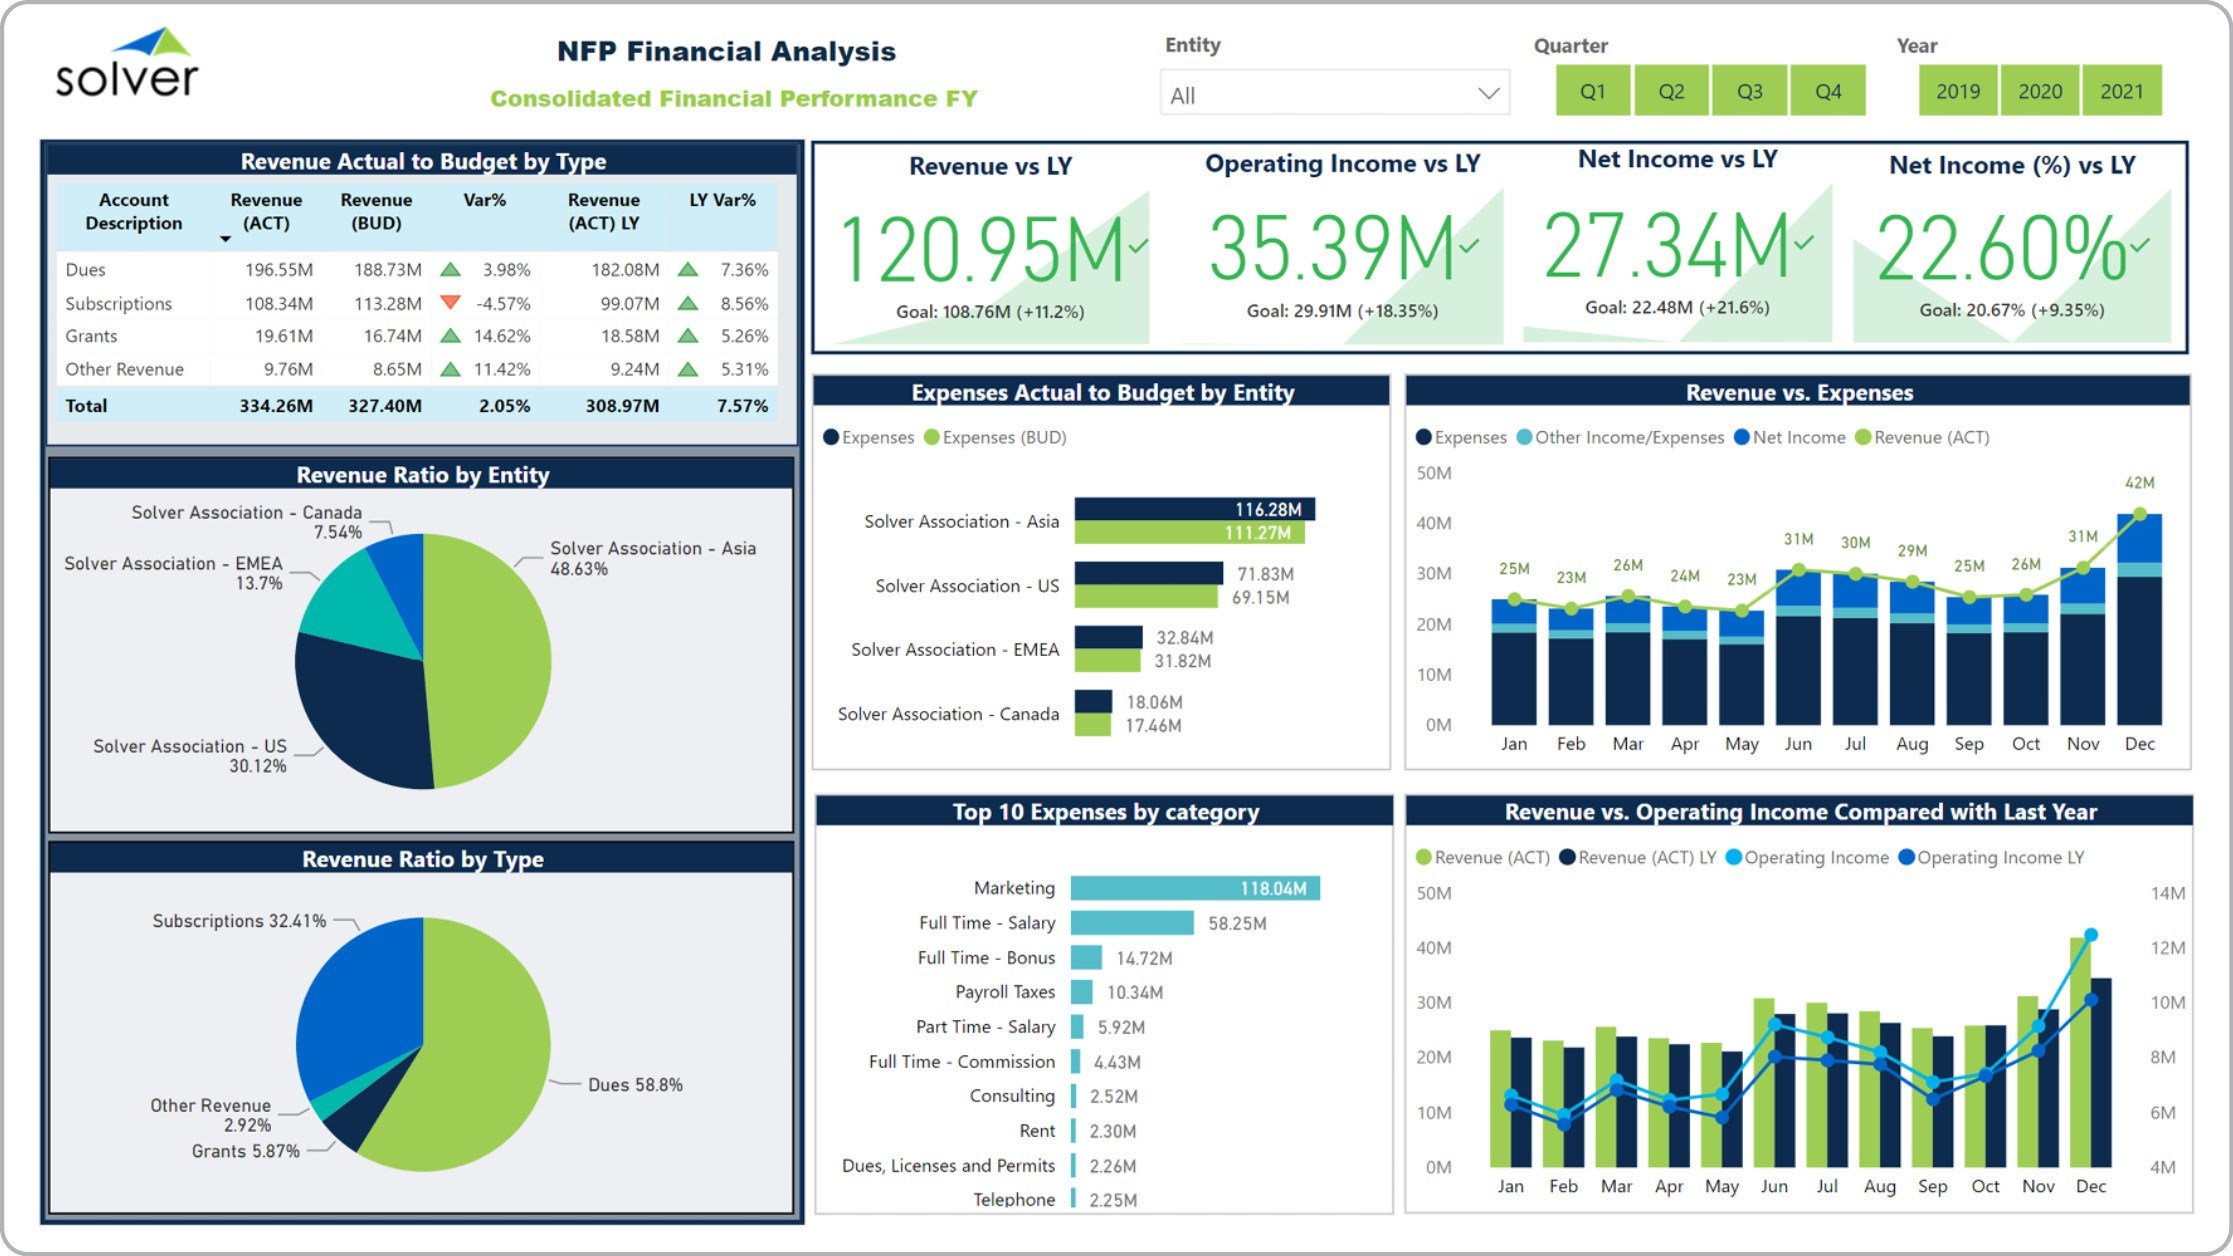
Financial Dashboard for Nonprofit Organizations
What is a Financial Dashboard for Nonprofits ? Financial Dashboards are considered analysis and ...
Profitability KPI Dashboard for Mobile Phones
What is Profitability KPIs for Mobile Phones ? Mobile apps that display profitability KPIs and ...
Revenue KPI Dashboard for Mobile Phone Users
What is a Revenue KPI dashboard for Mobile Phones ? Mobile apps that display revenue KPIs and ...
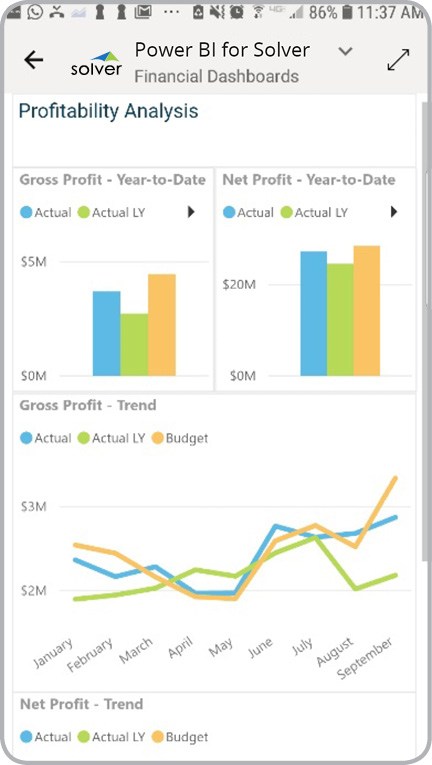
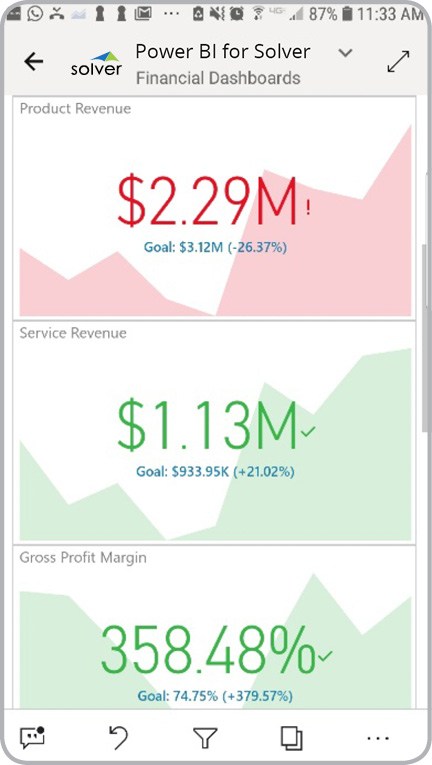
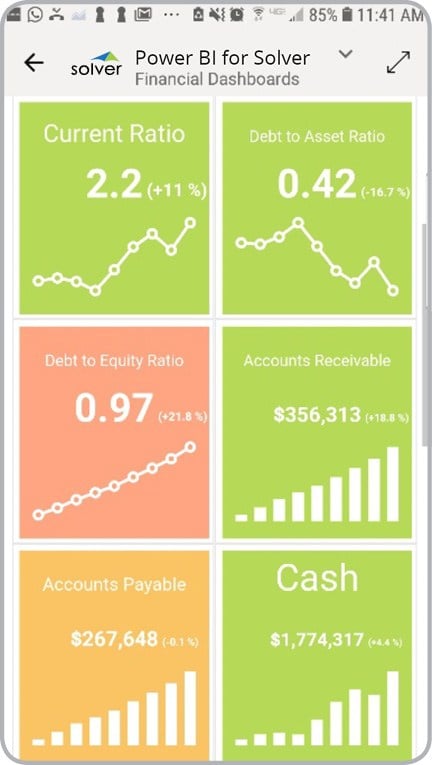
Financial KPI Dashboard for Mobile Phones
What is a Financial KPI Mobile App ? Mobile apps that display financial KPIs and charts are ...
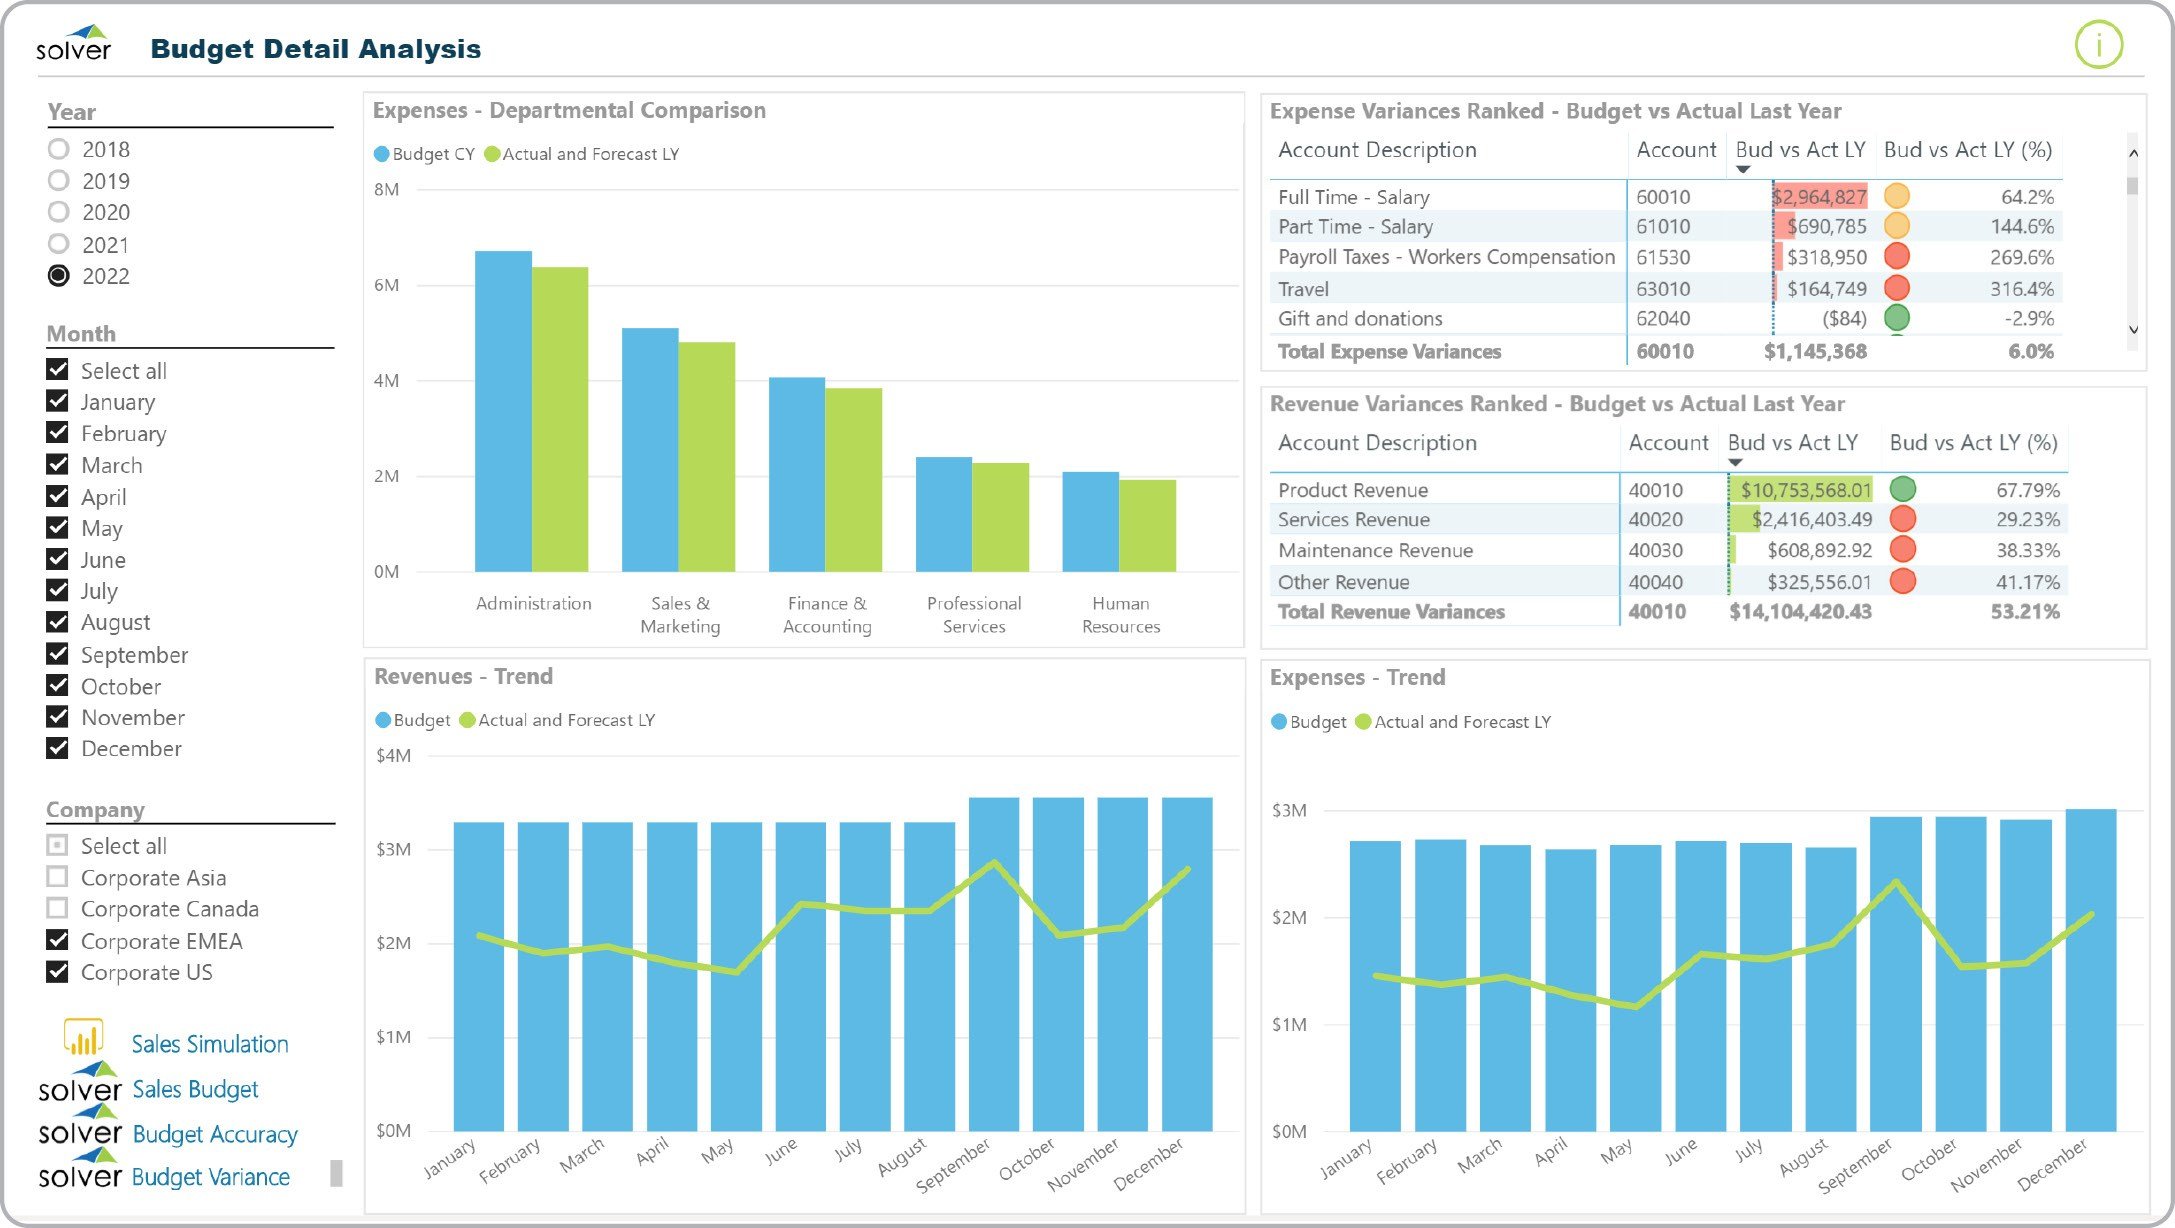
Budget Detail Dashboard Example
What is a Budget Detail Dashboard ? Budget Detail Dashboards are considered planning analysis tools ...
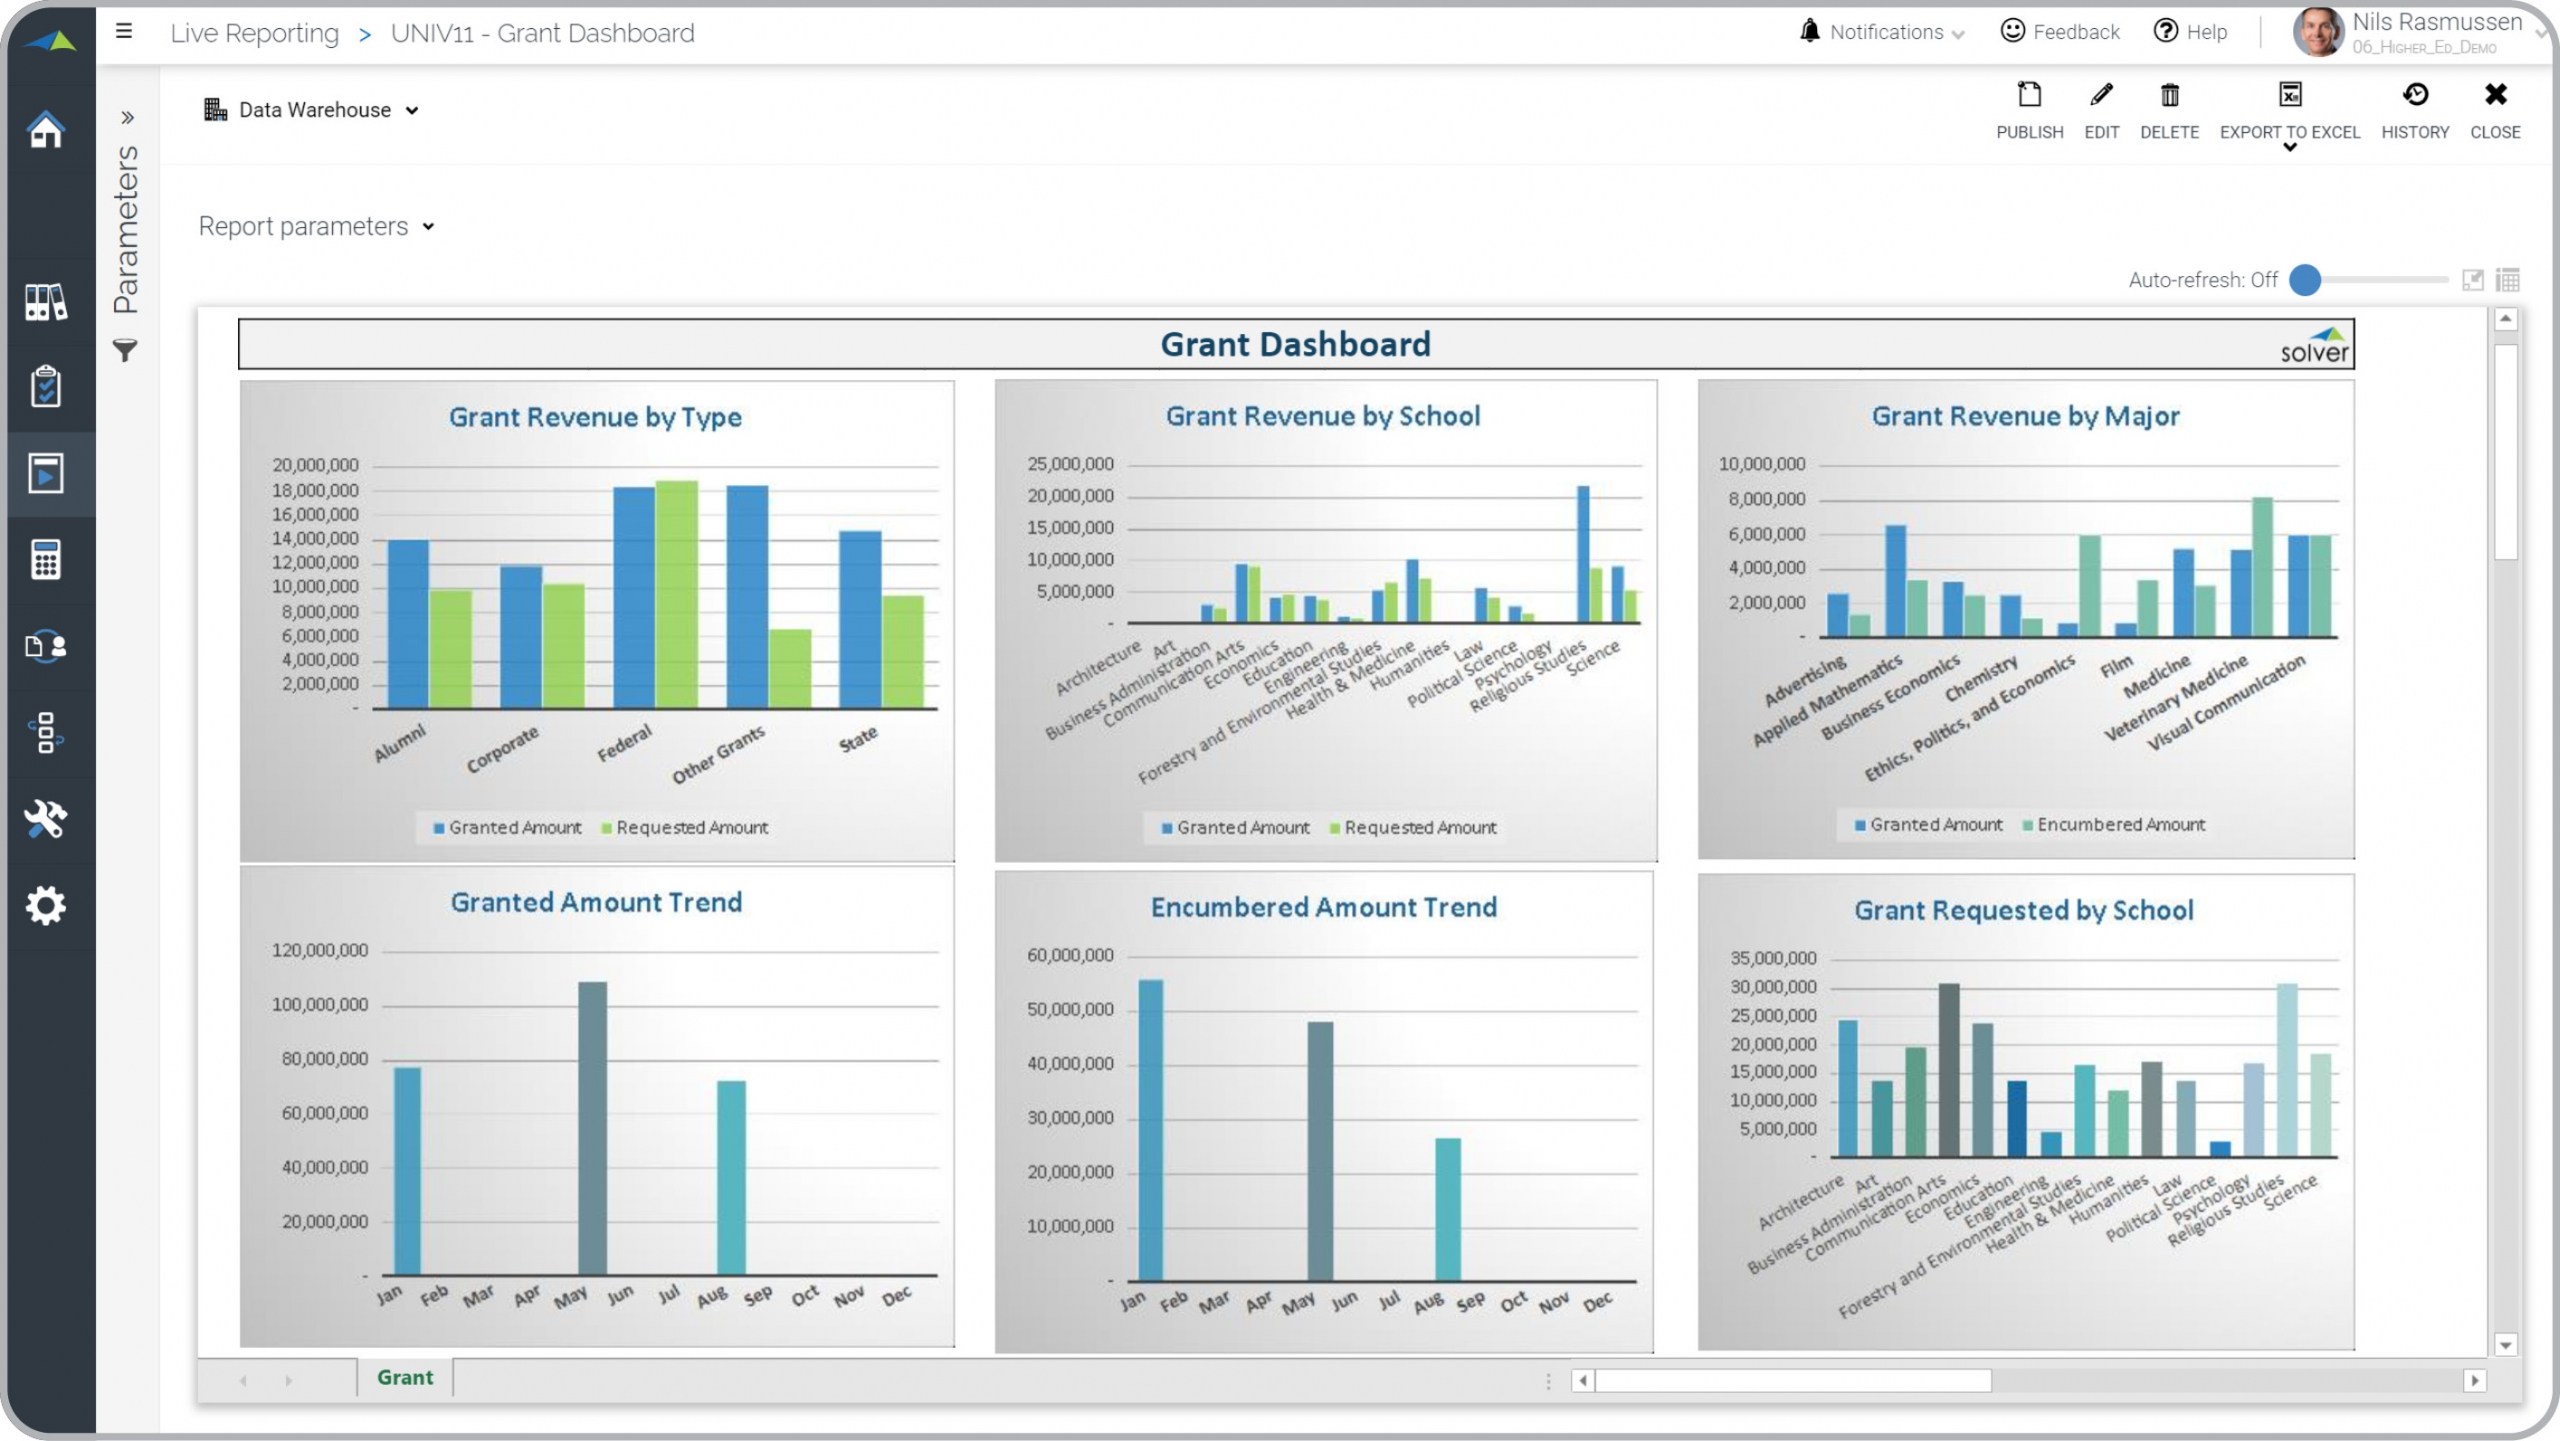
Higher Education Grant Dashboard
What is a Grant Dashboard? Grant Dashboards are considered analytical management tools and are used ...
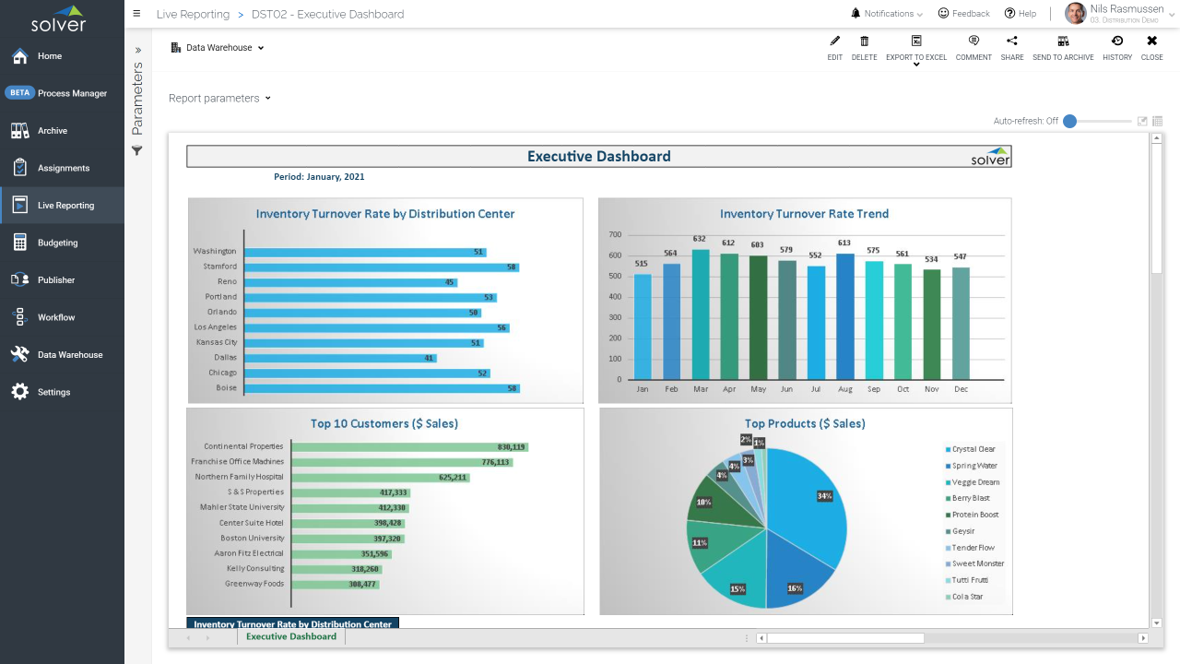
Executive Dashboard for a Distribution Company
What is an Executive Dashboard for a Distribution Company ? Executive dashboards are considered ...
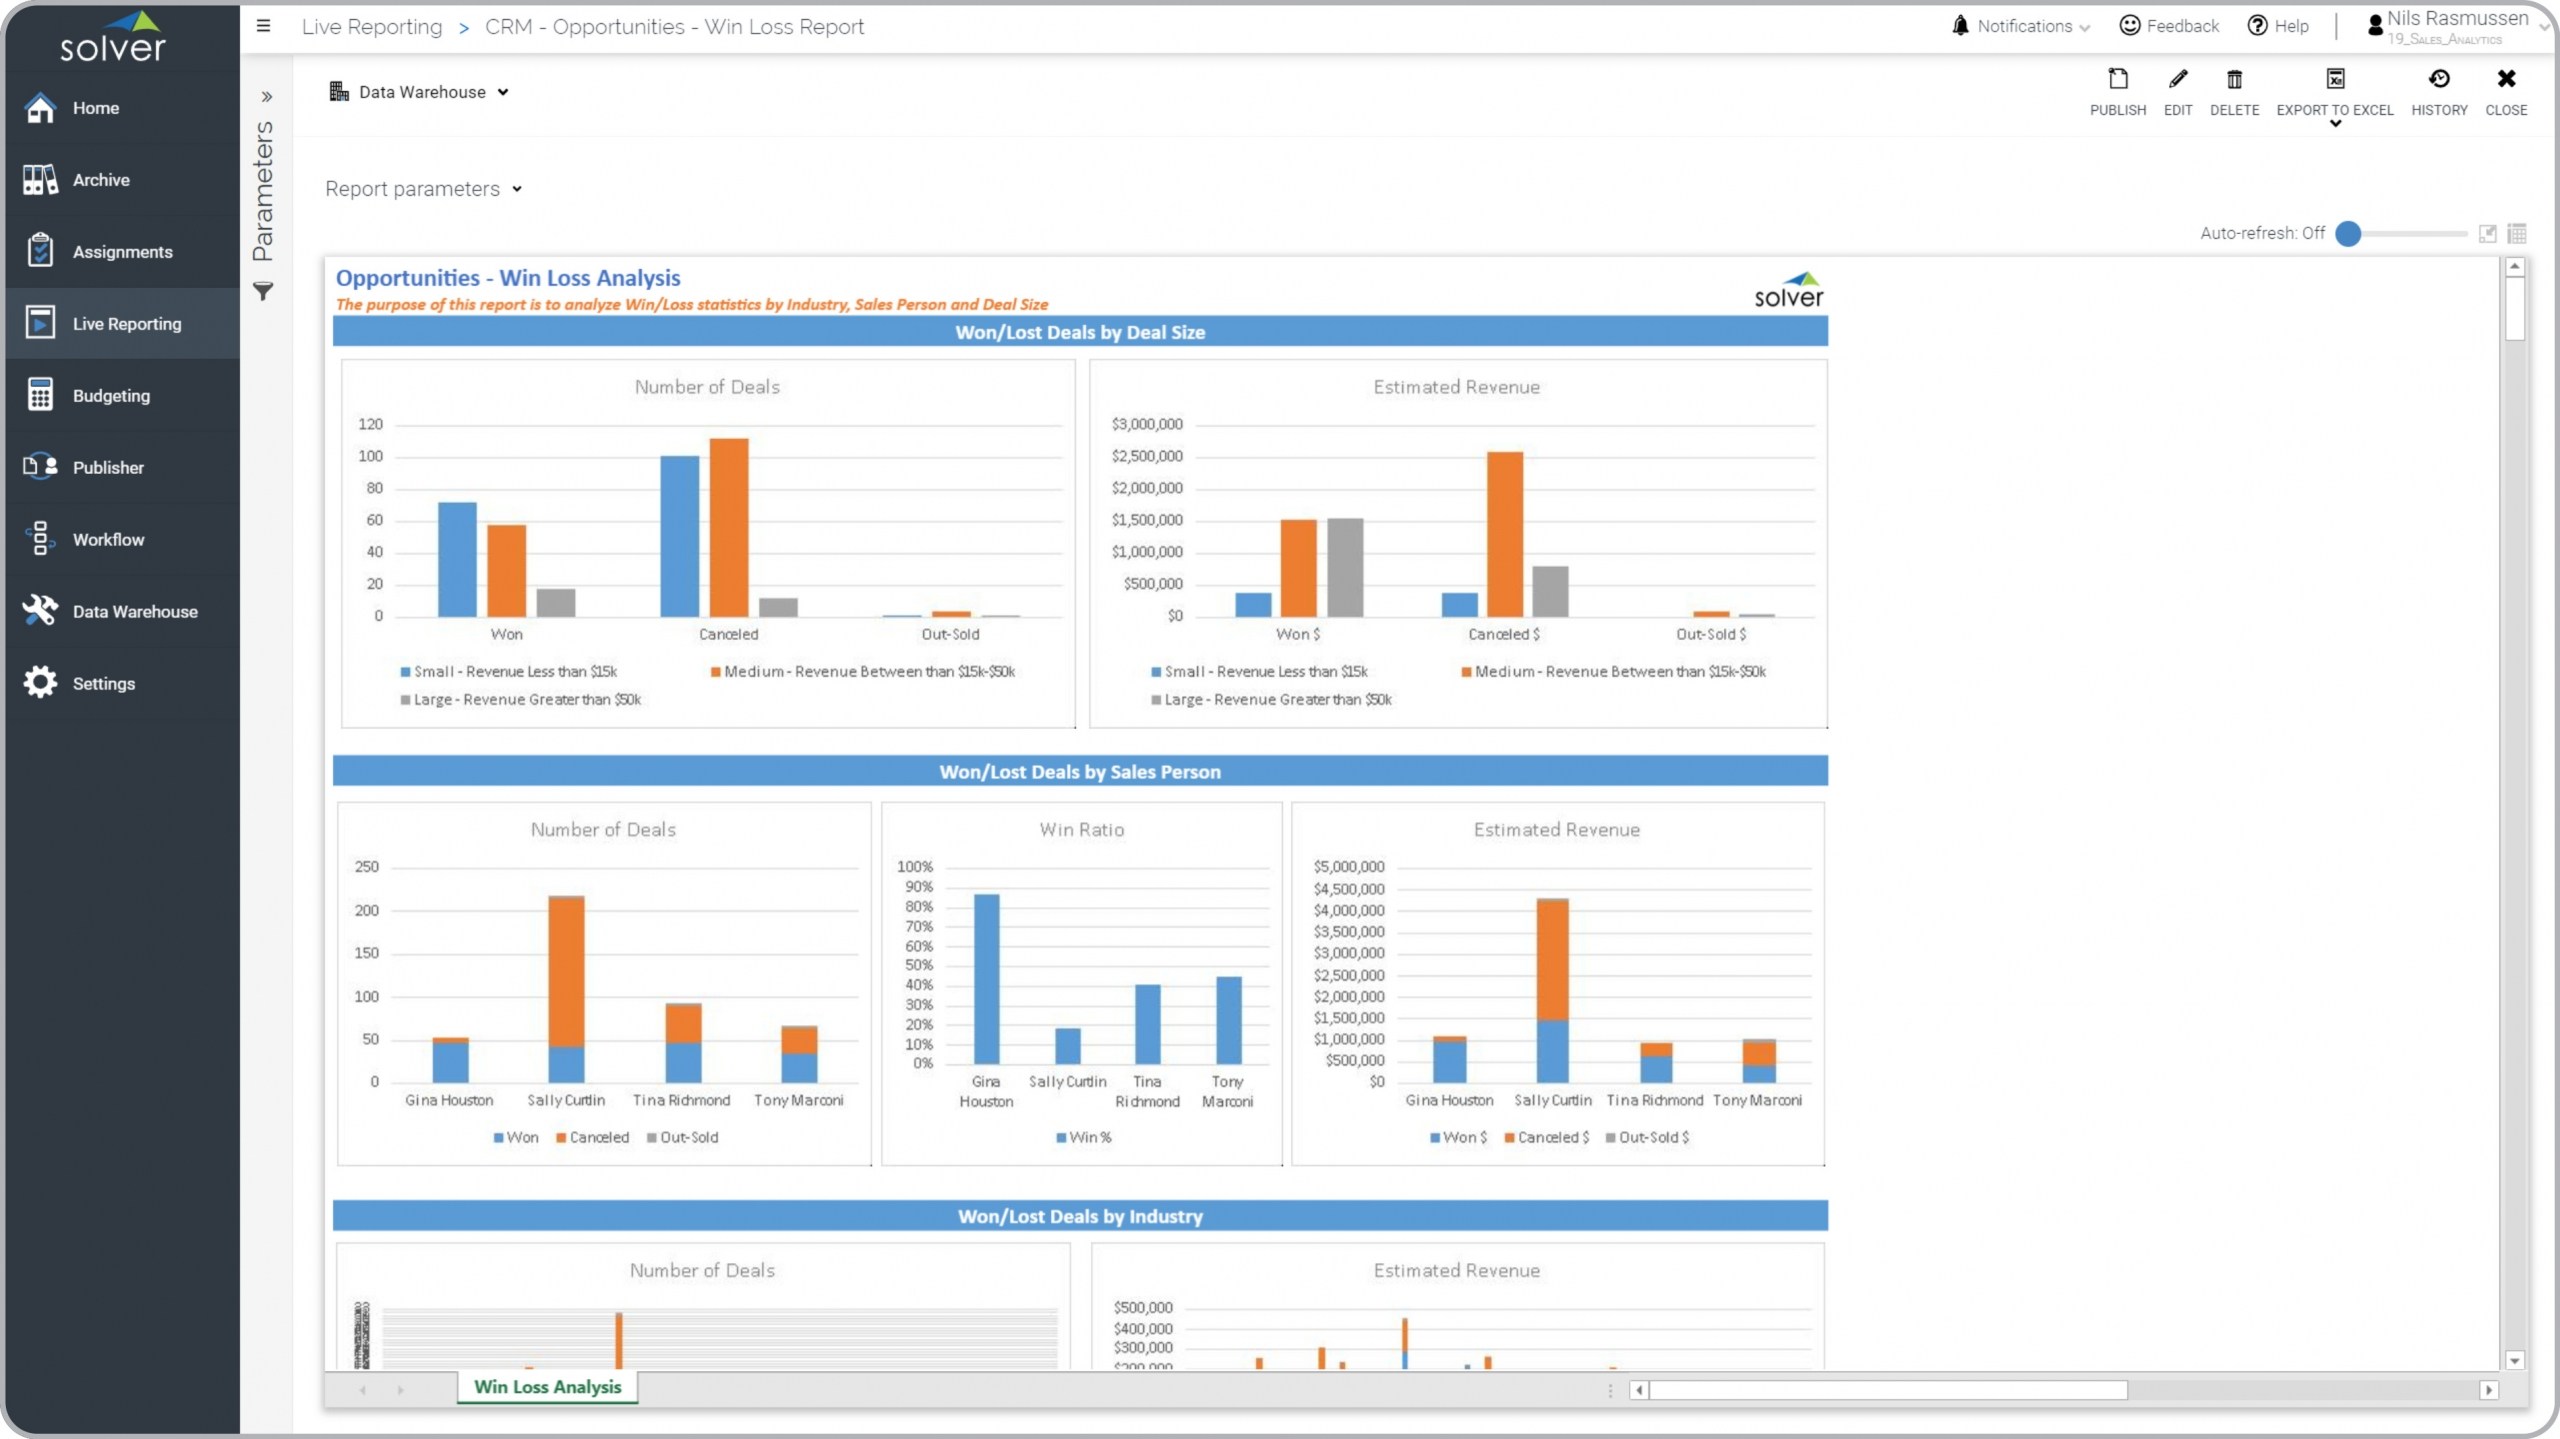
Win Loss Dashboard Report by Person, Deal Size and Industry
What is a Win Loss Dashboard Report by Person, Deal and Industry ? Win Loss dashboard reports are ...
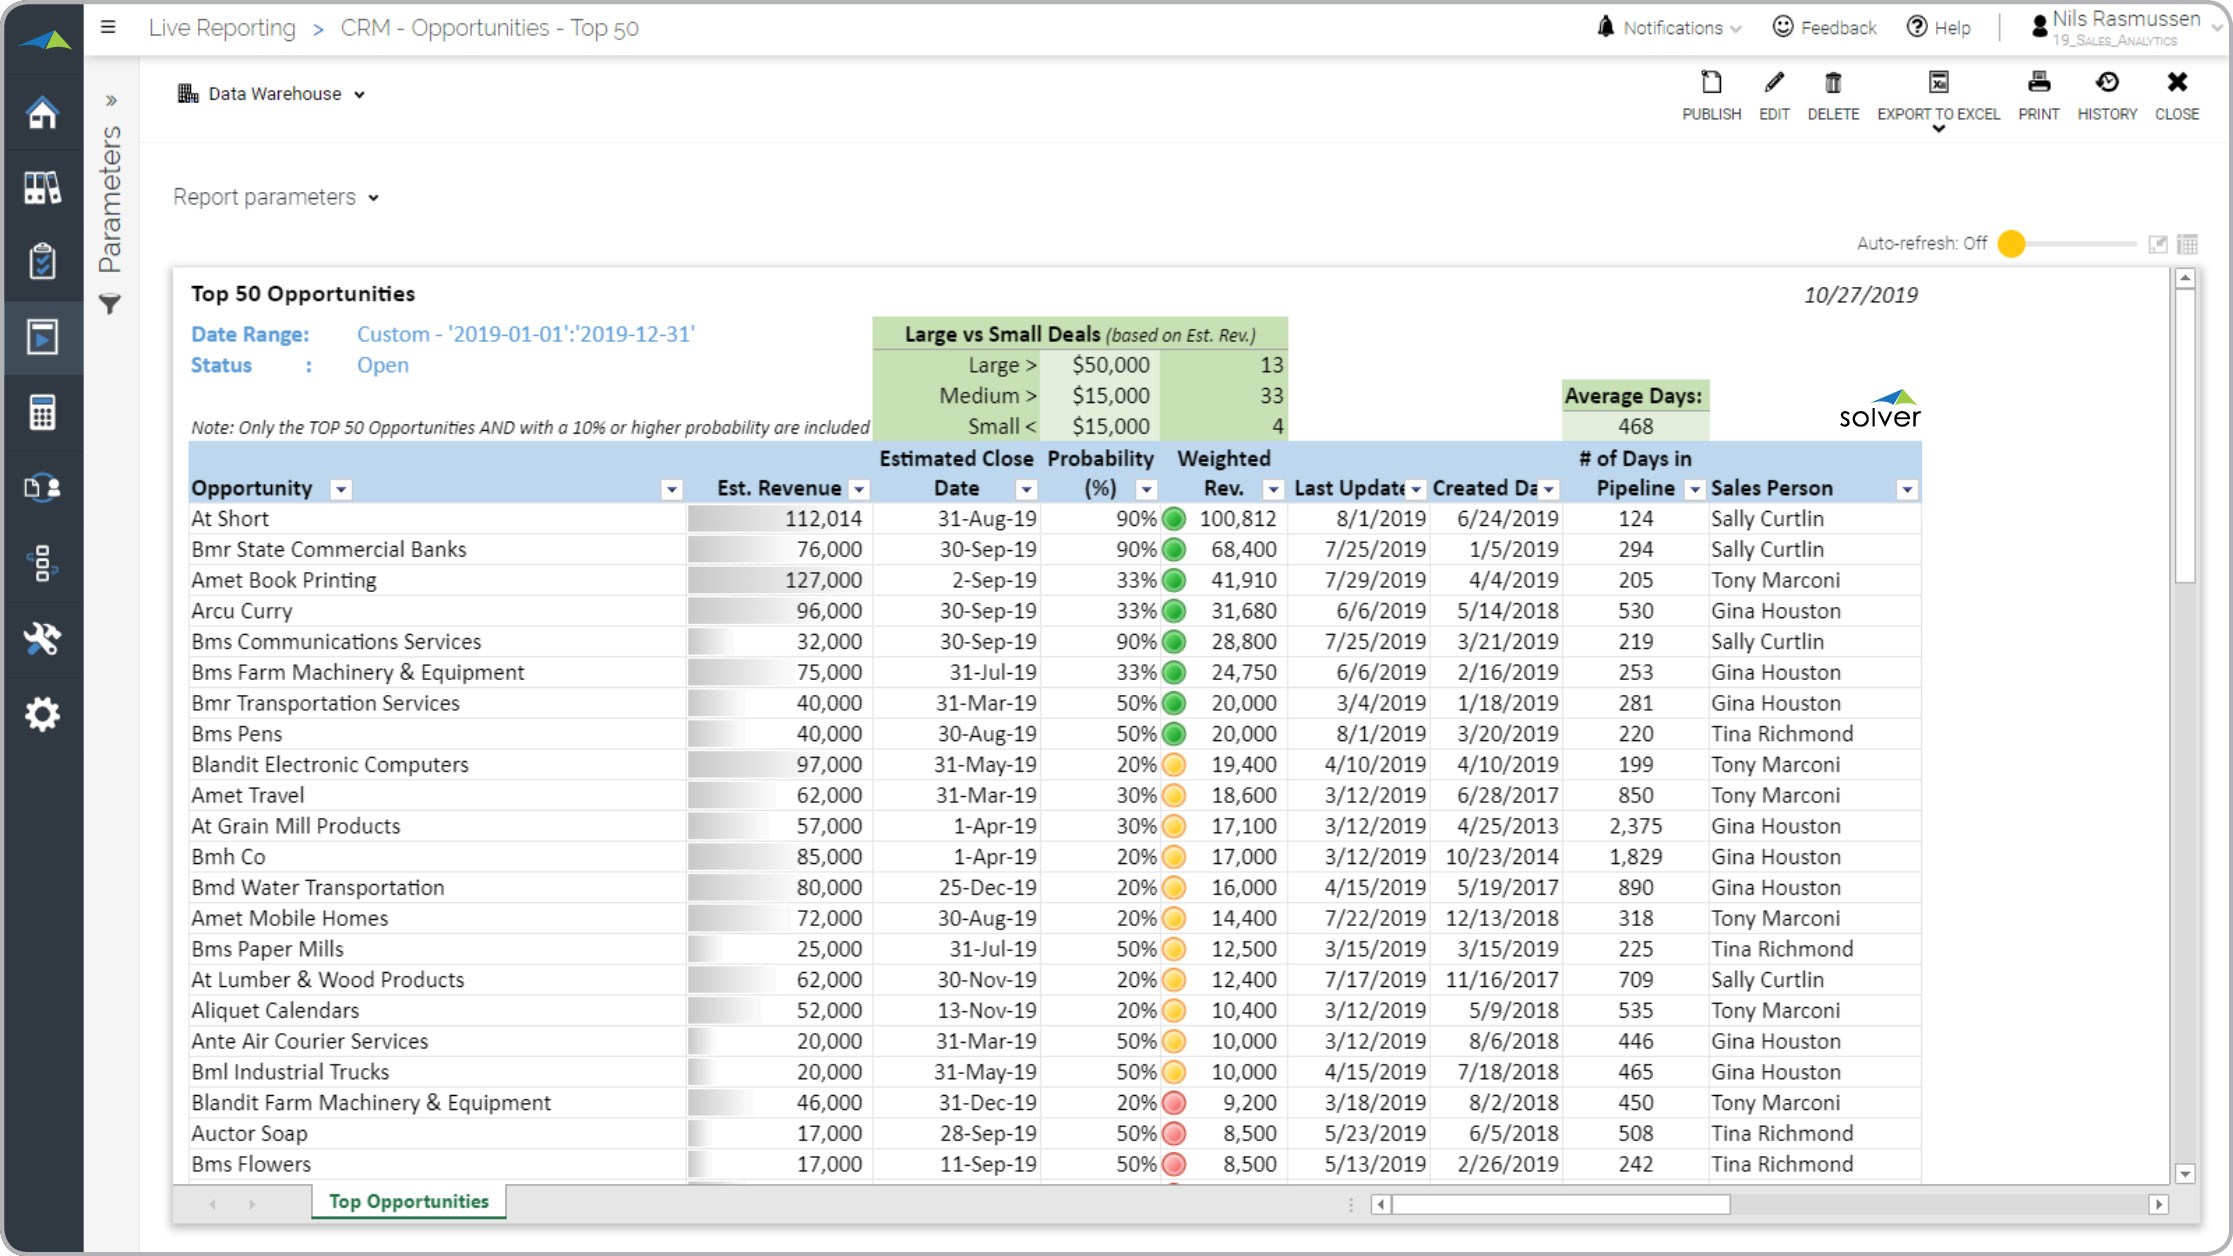
Top Sales Opportunities KPI Report
What is a Top Sales Opportunities KPI Report ? Top opportunity reports are considered pipeline ...
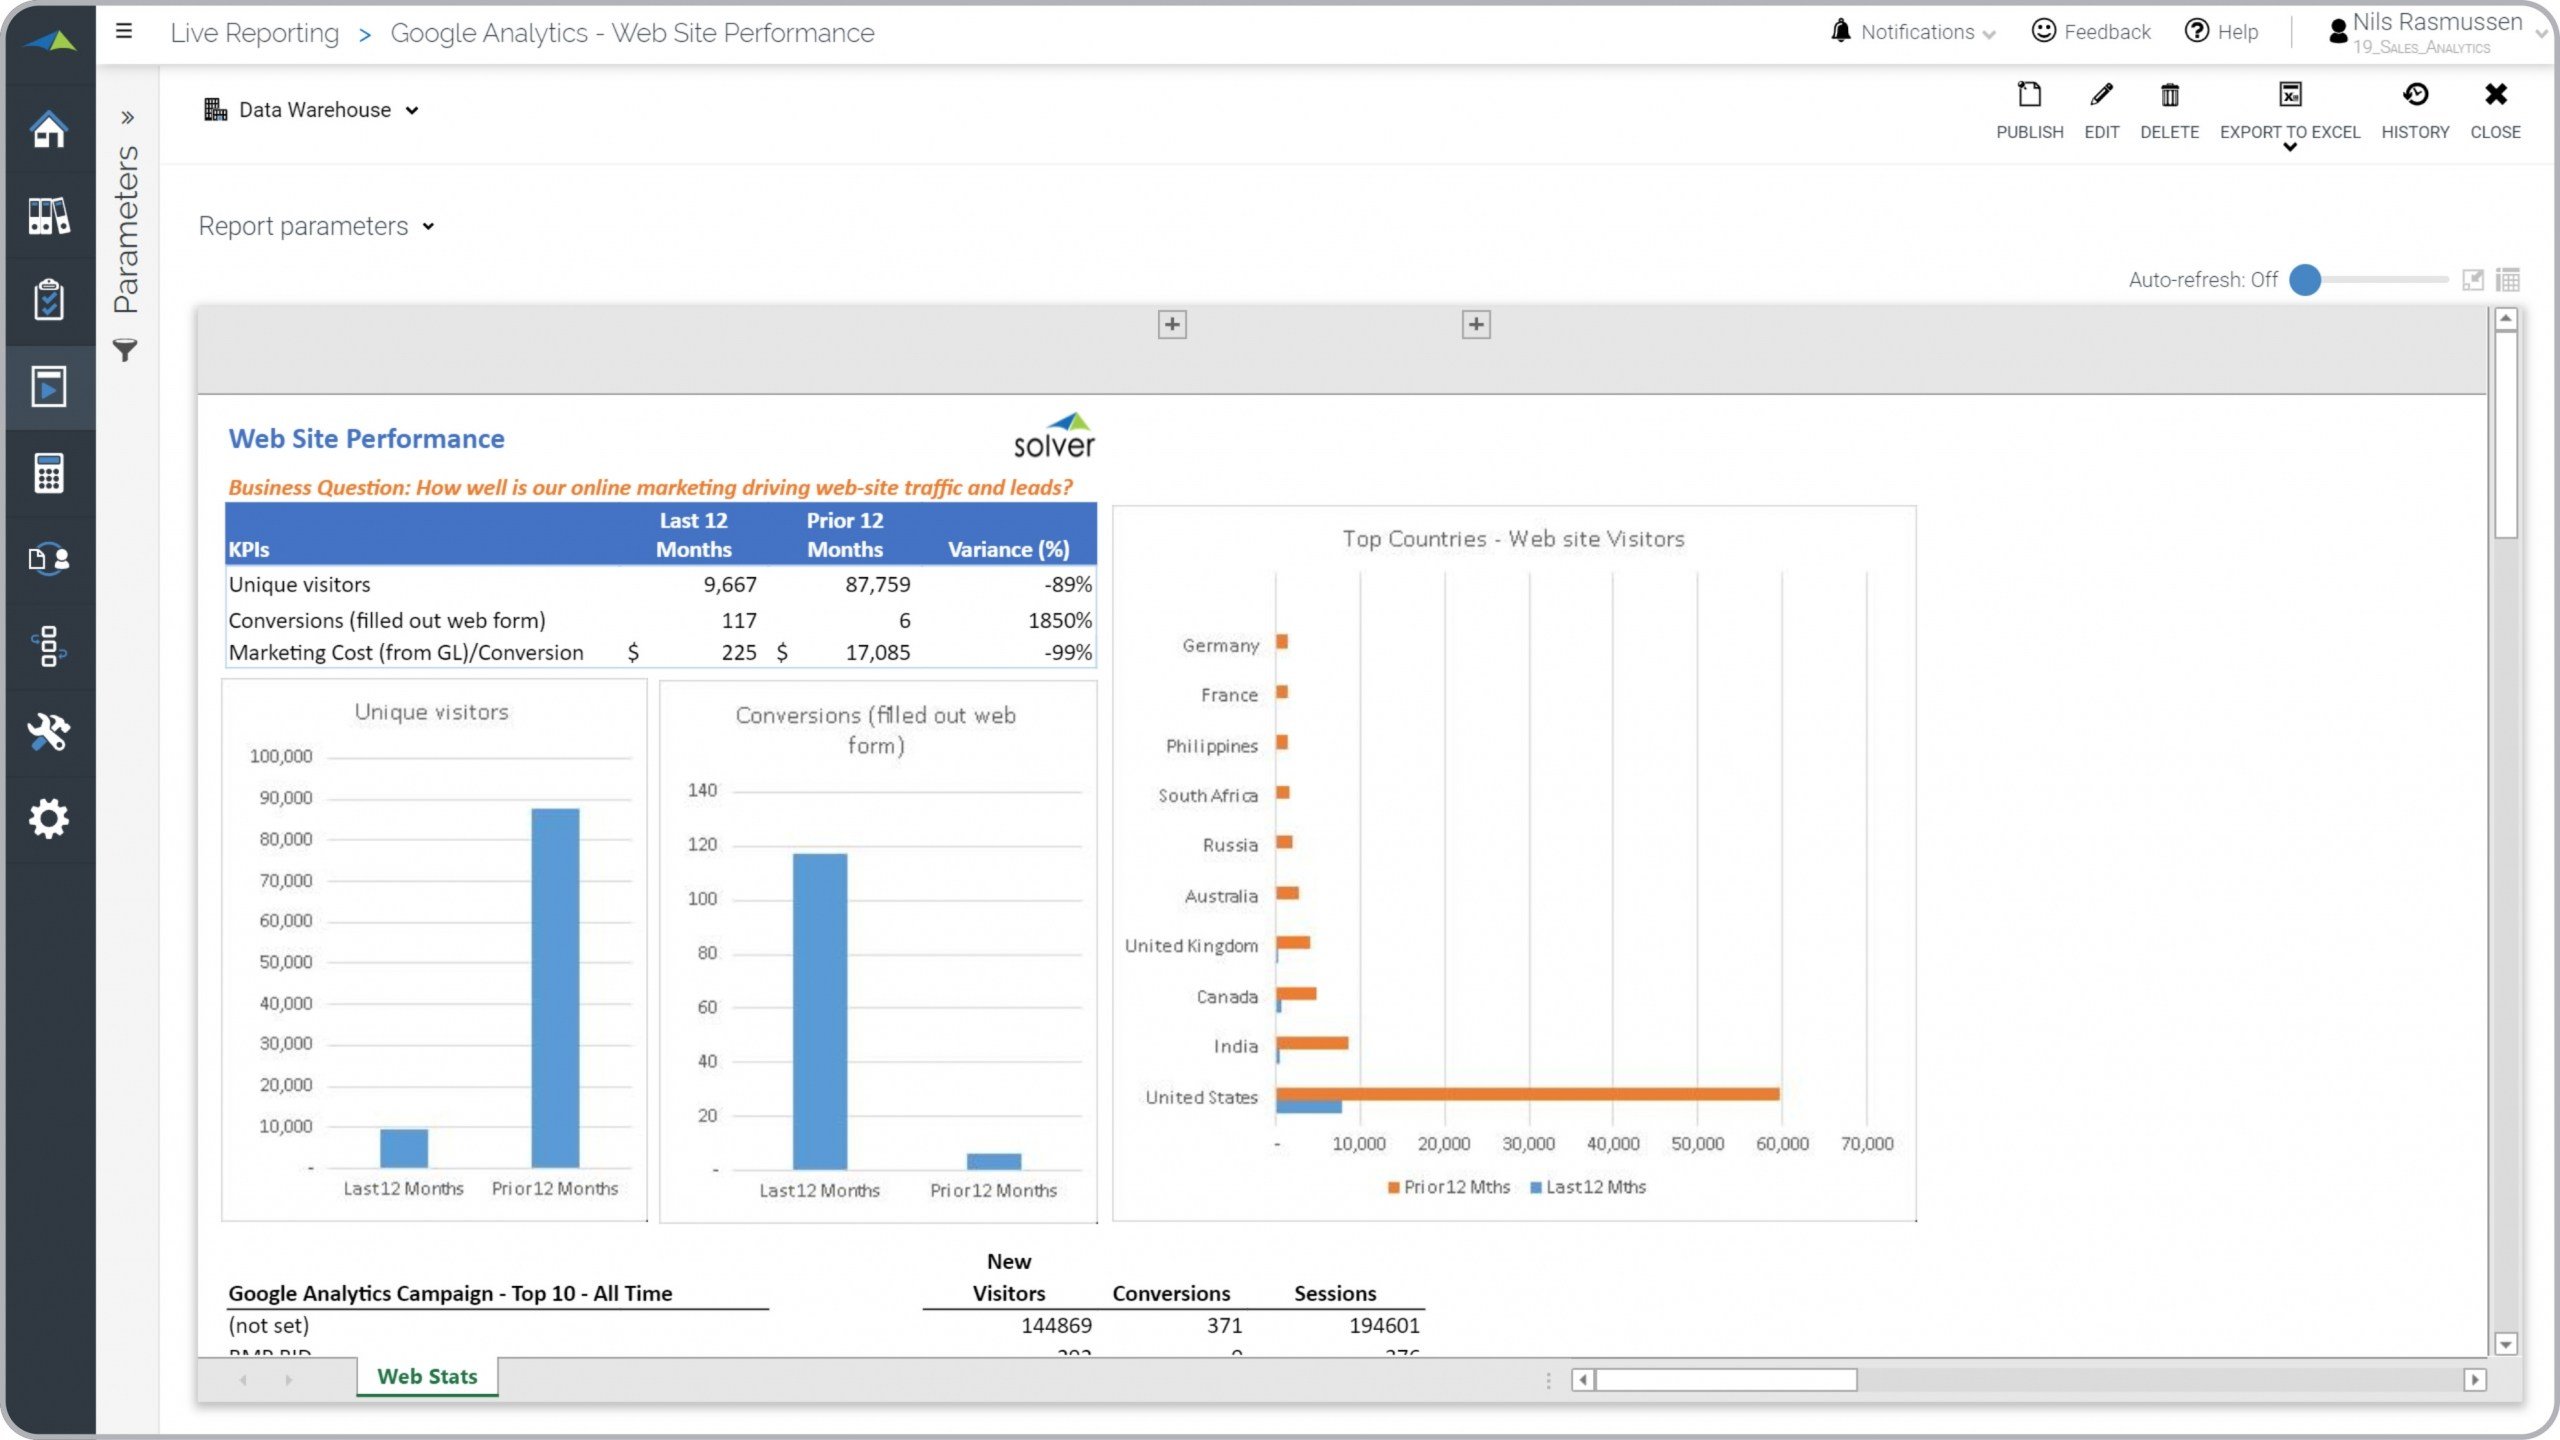
Website Efficiency Report
What is a Website Efficiency Report ? Website efficiency reports are considered web analytics tools ...
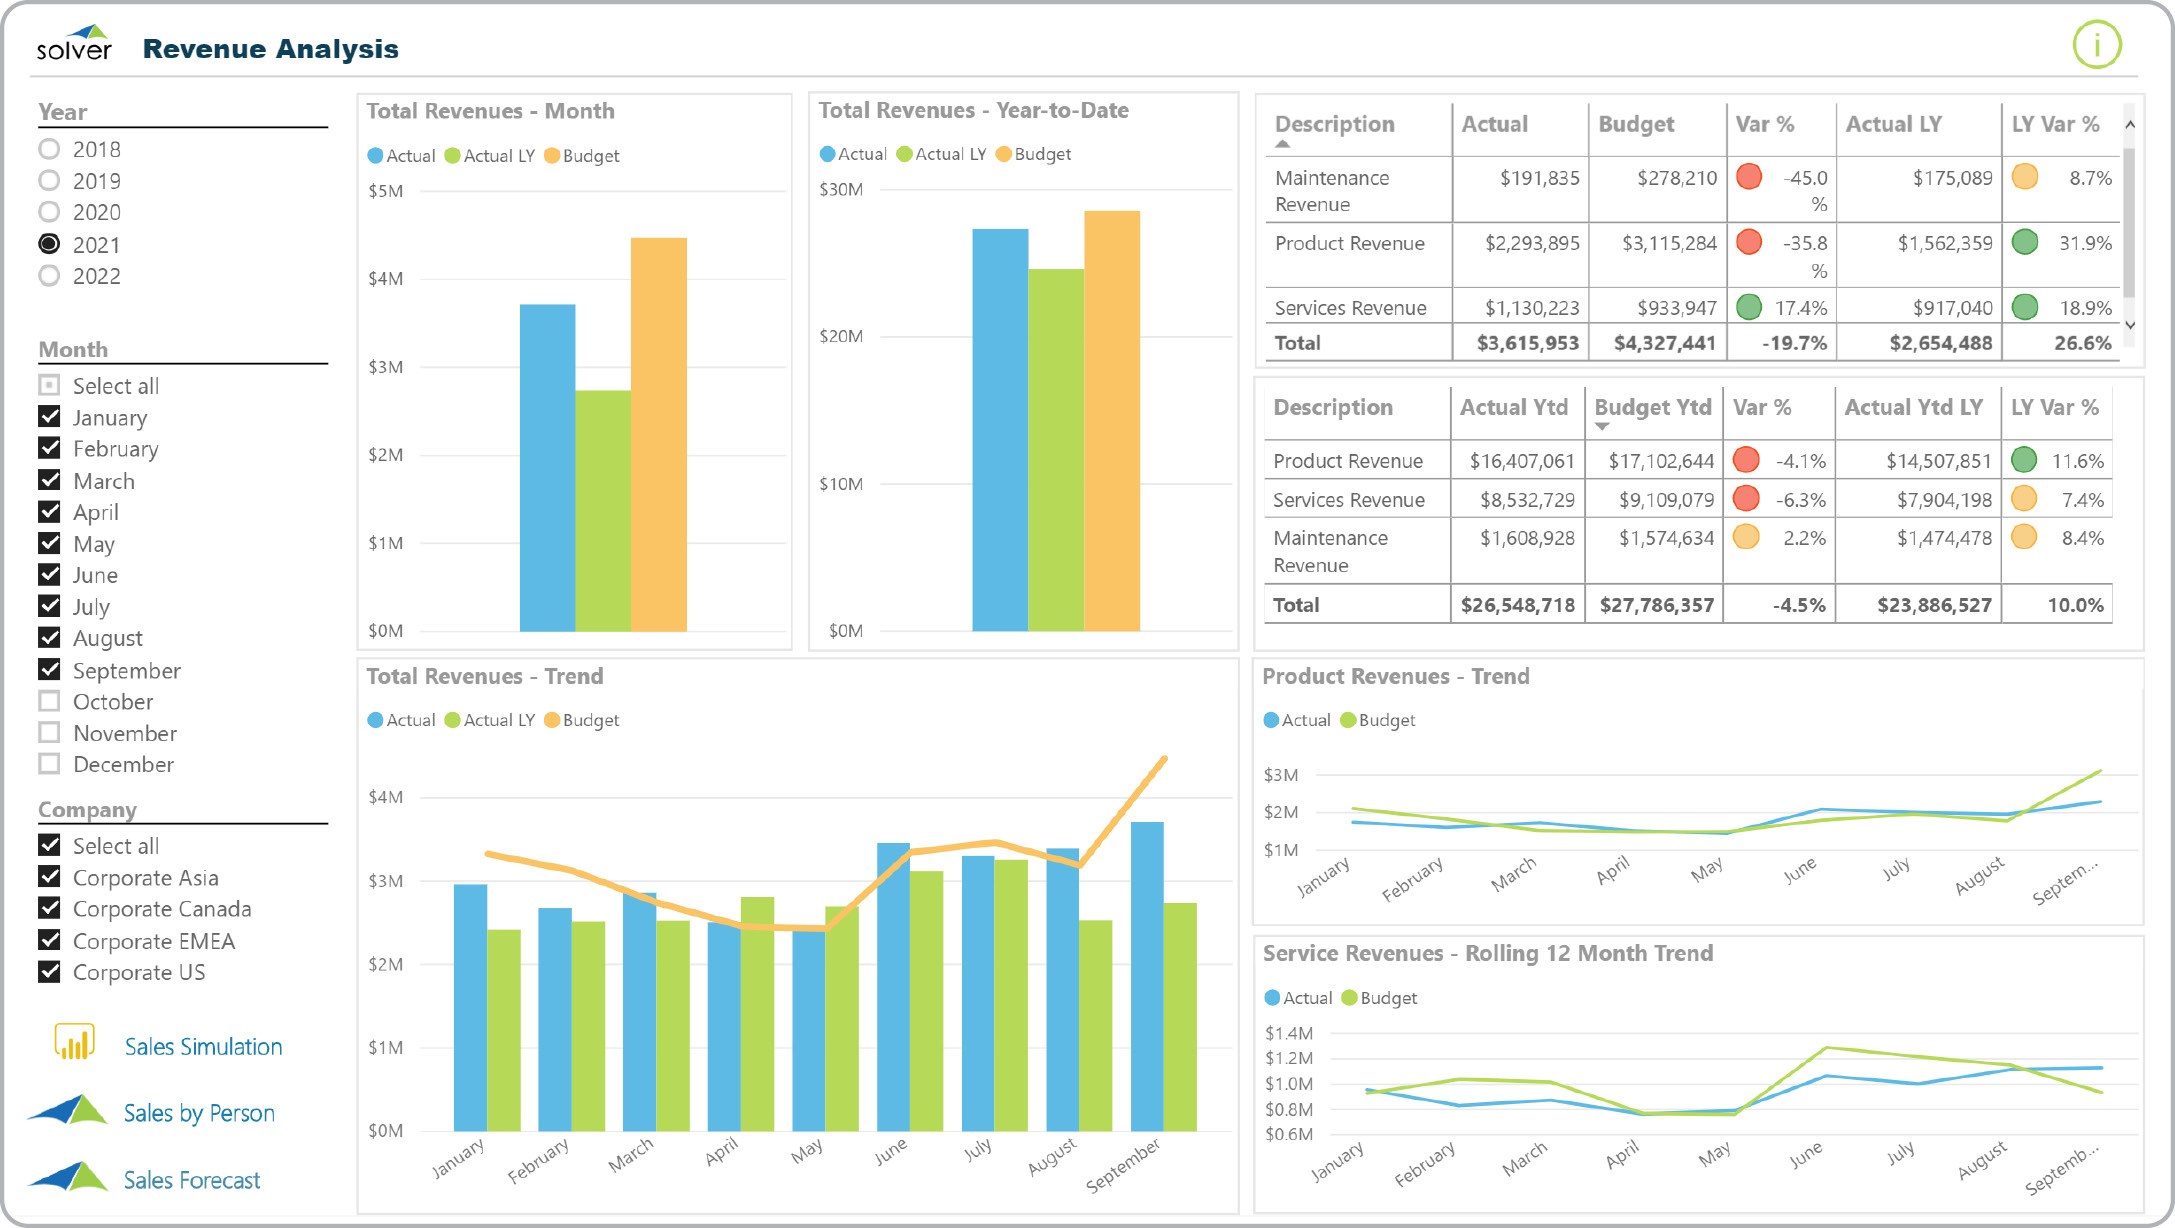
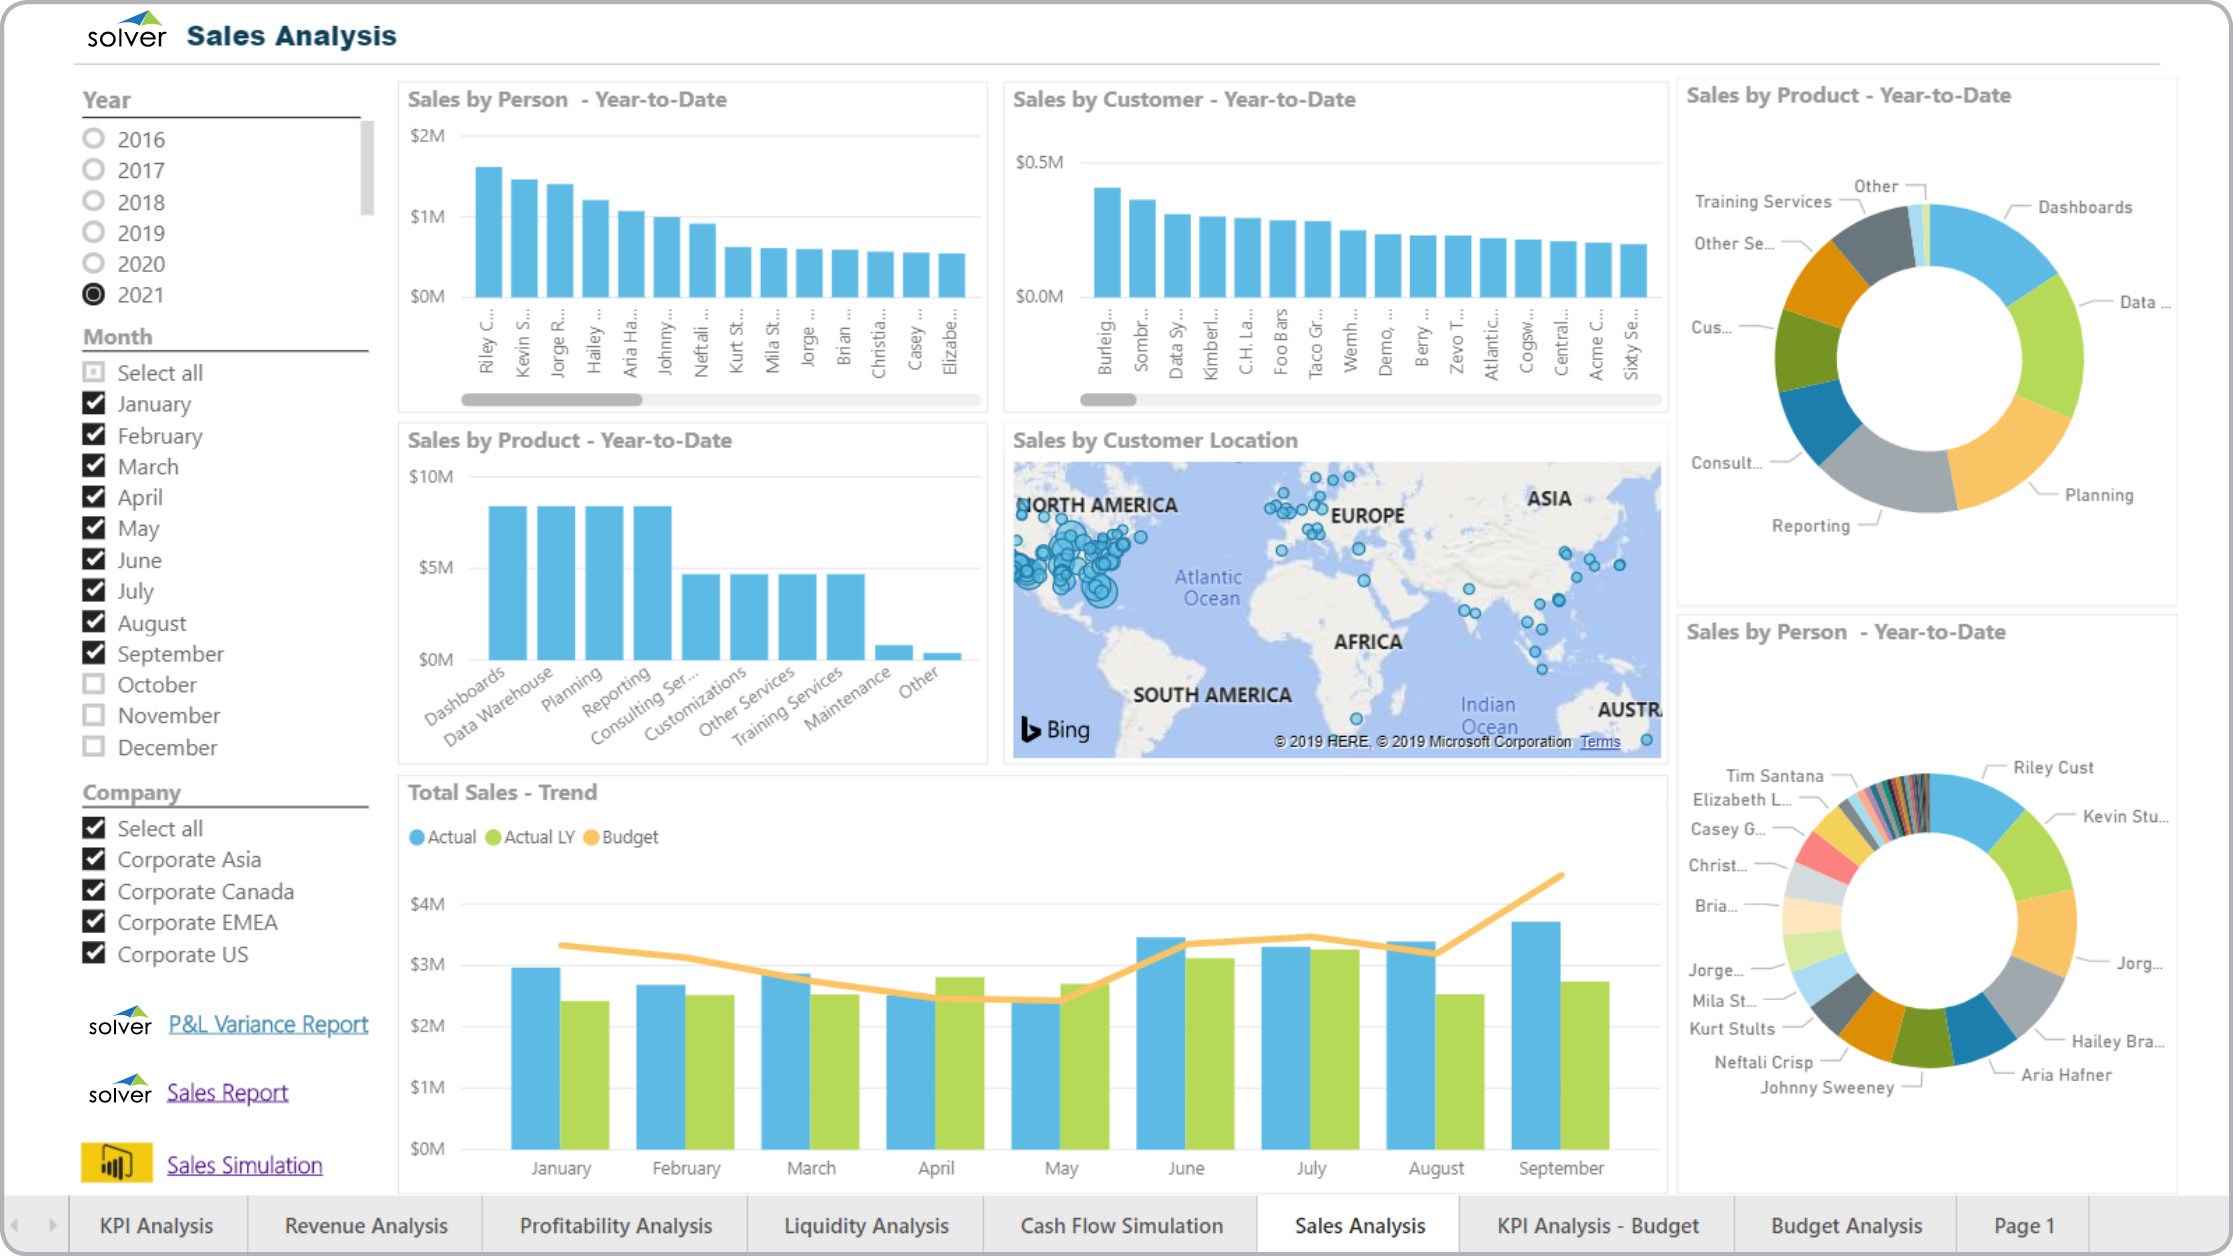
Revenue Analysis Dashboard
What is a Revenue Analysis Dashboard ? Revenue Dashboards are considered financial dashboards and ...
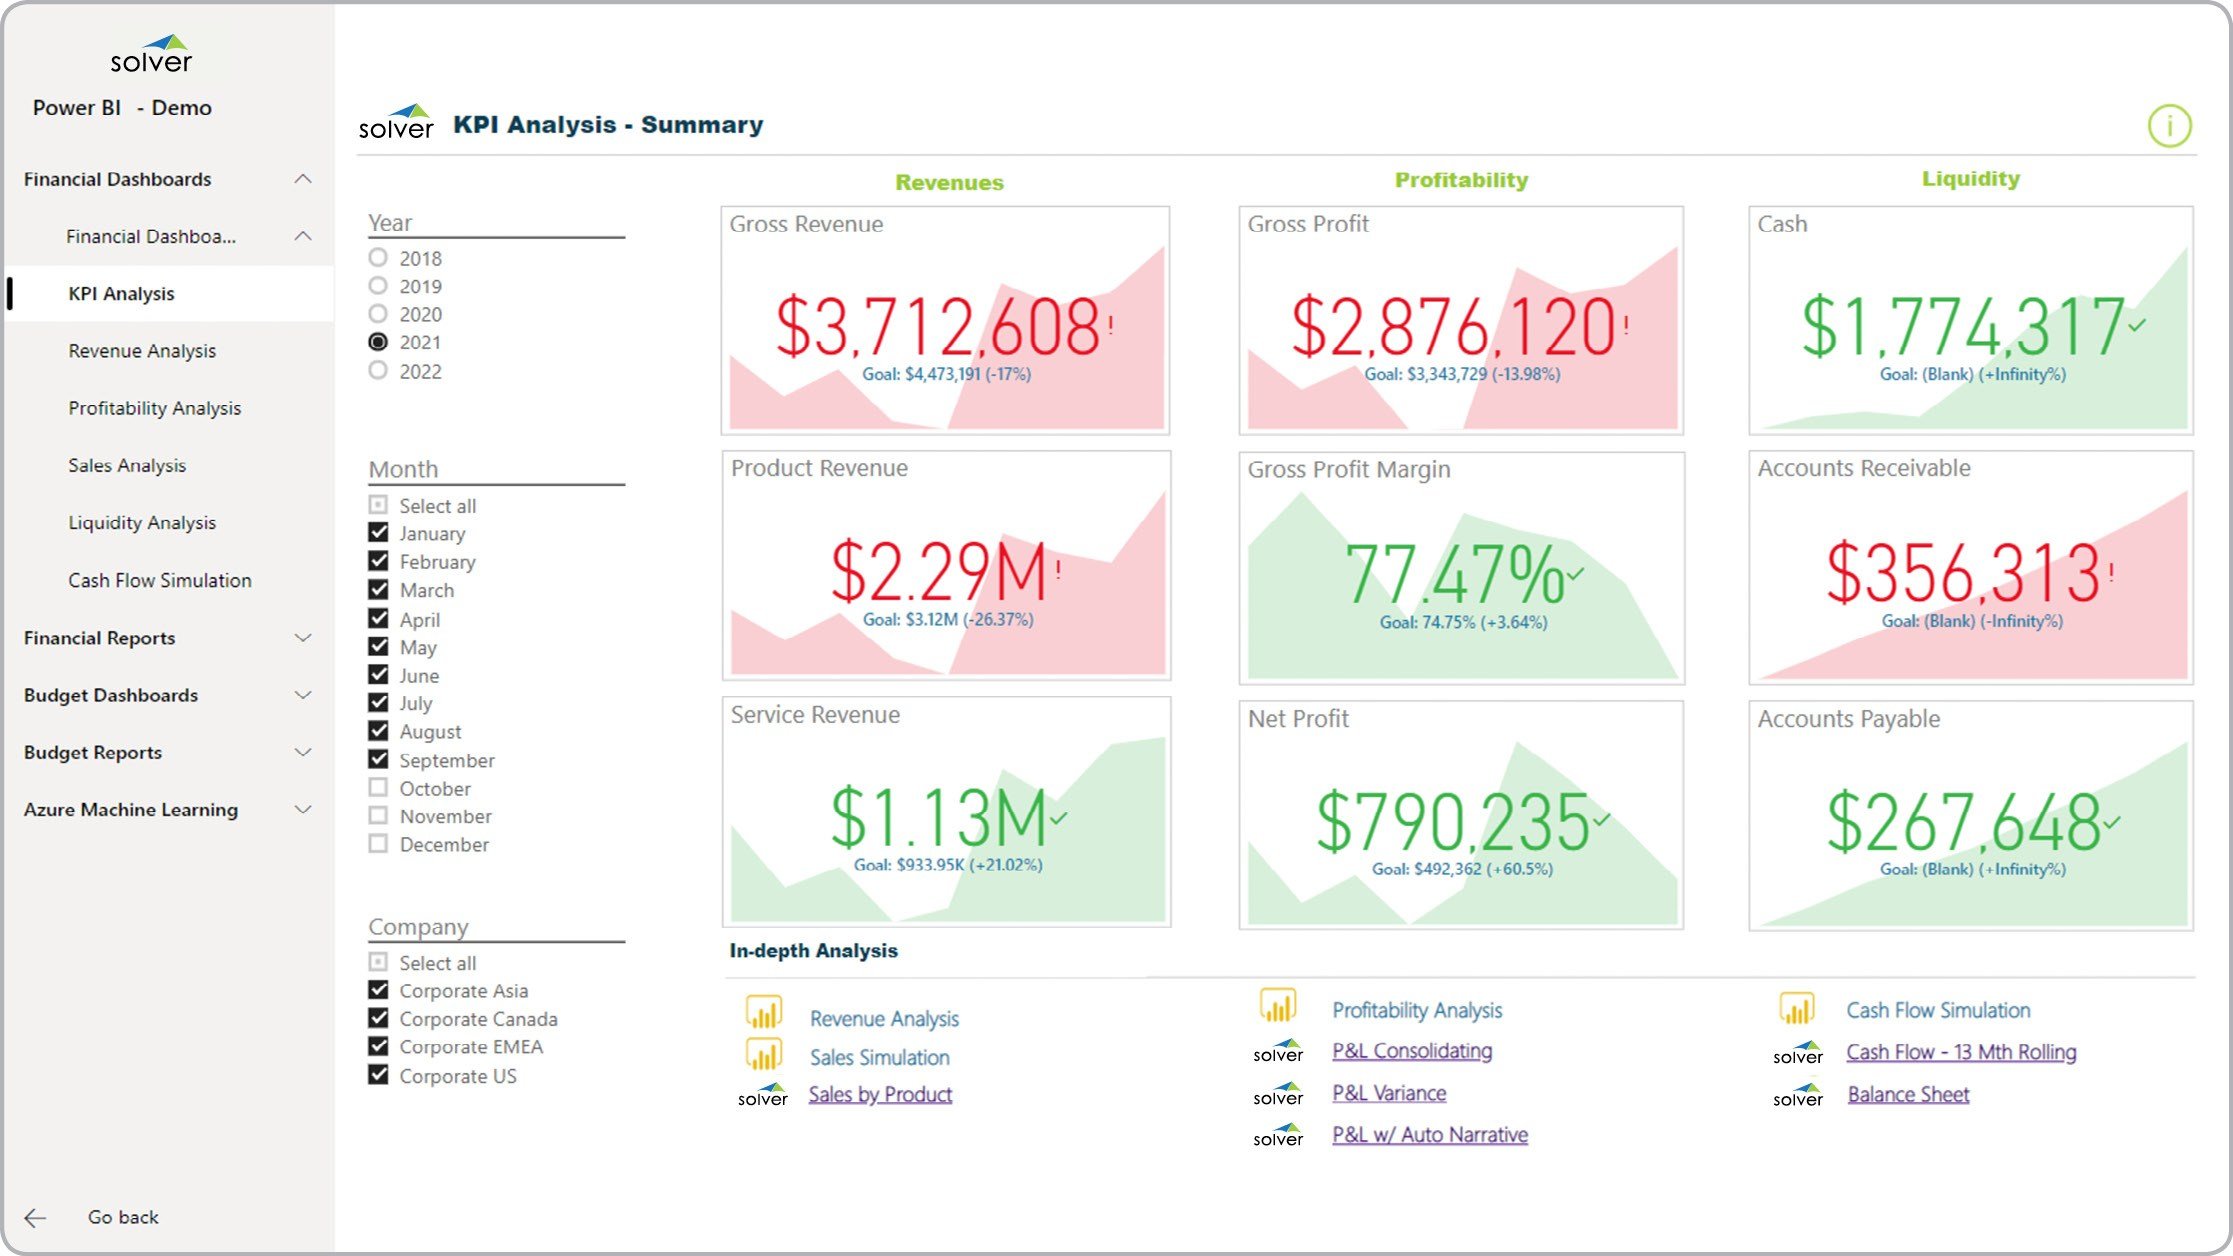
Financial KPI Dashboard
What is a Financial KPI Dashboard ? Financial Key Performance Indicator (KPI) Dashboards are ...
Sales Dashboard
What is a Sales Dashboard ? Sales visualization tools are considered operational dashboards and are ...
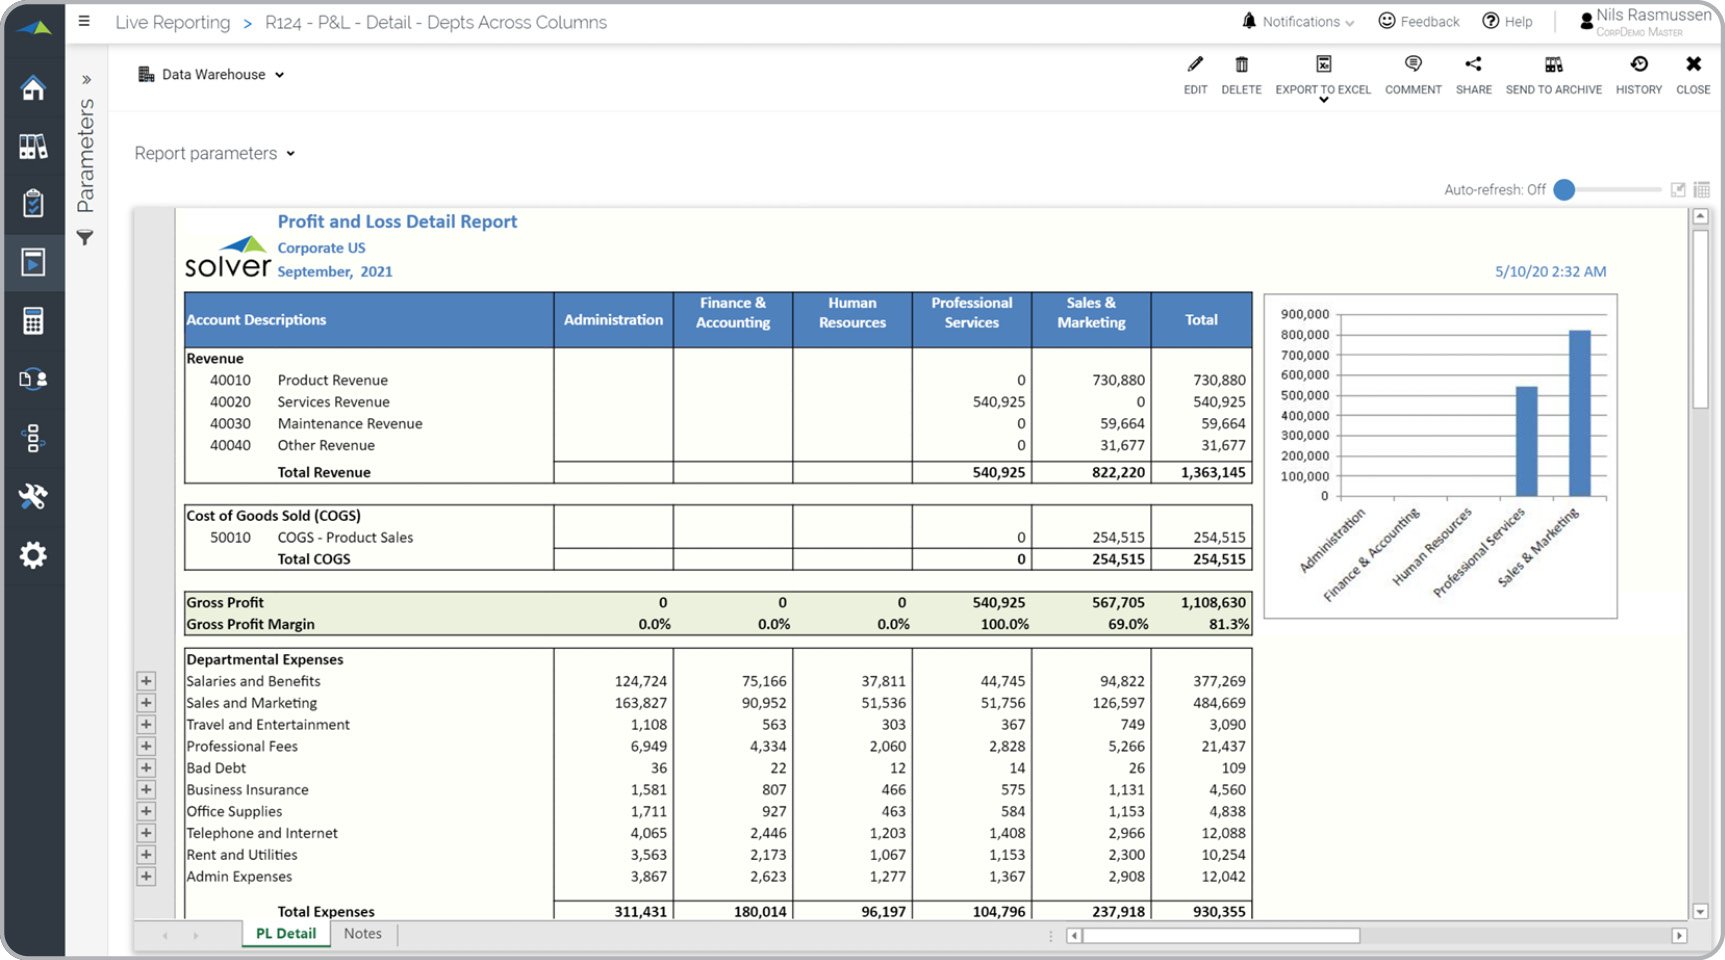
Profit & Loss Report with Department Comparisons
What is a Profit & Loss Report with Department Comparisons ? Financial statements with ...
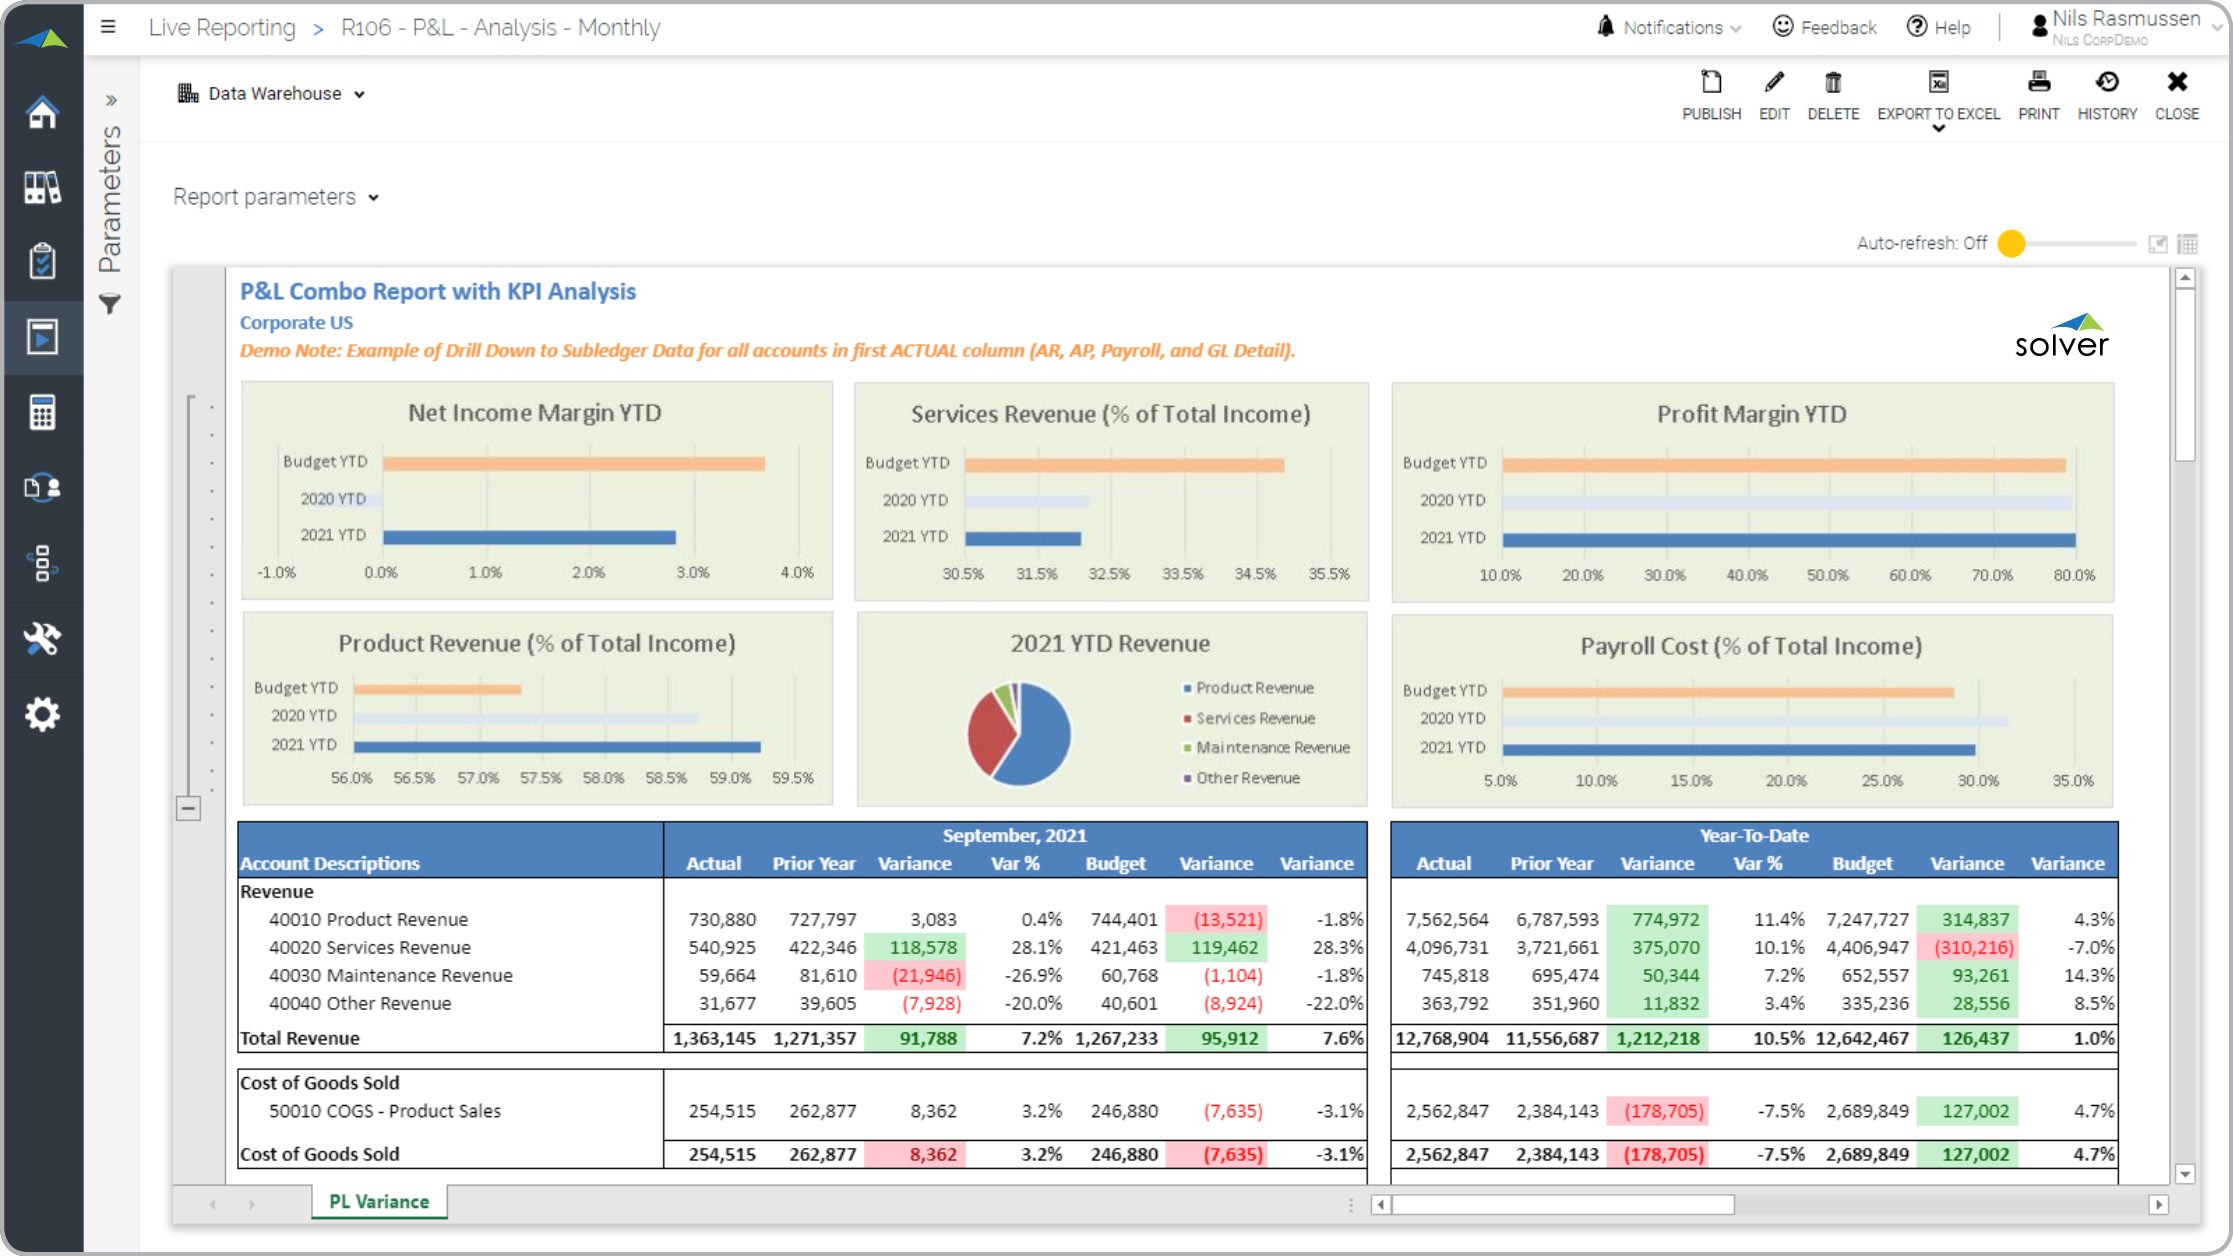
Profit & Loss Variance Report
What is a Profit & Loss Variance Report ? Profit & Loss Variance Reports are considered a ...
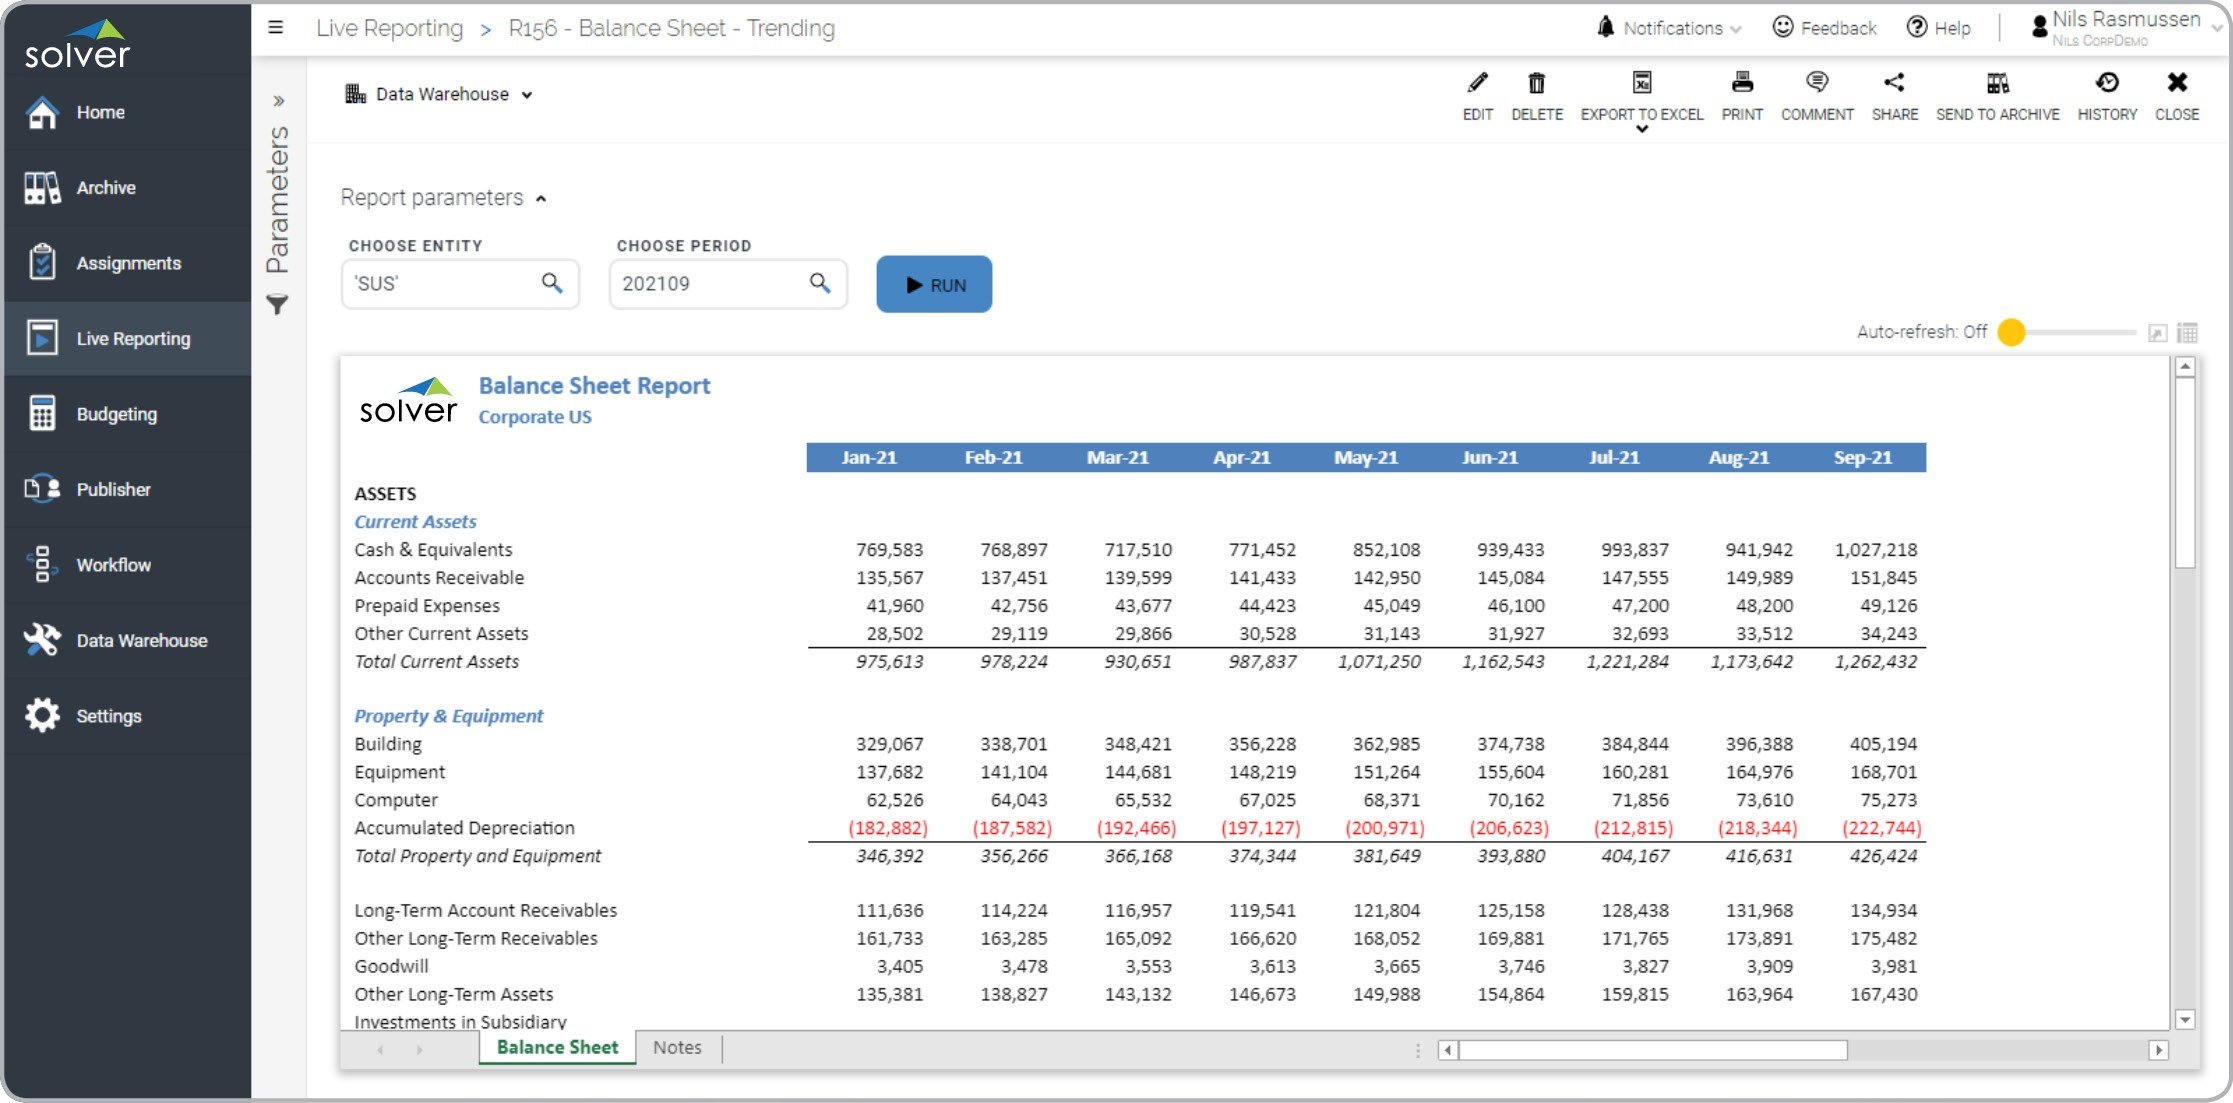
Trended Balance Sheet Report
What is a Trended Balance Sheet Report ? Trended Balance Sheets are considered key month-end ...
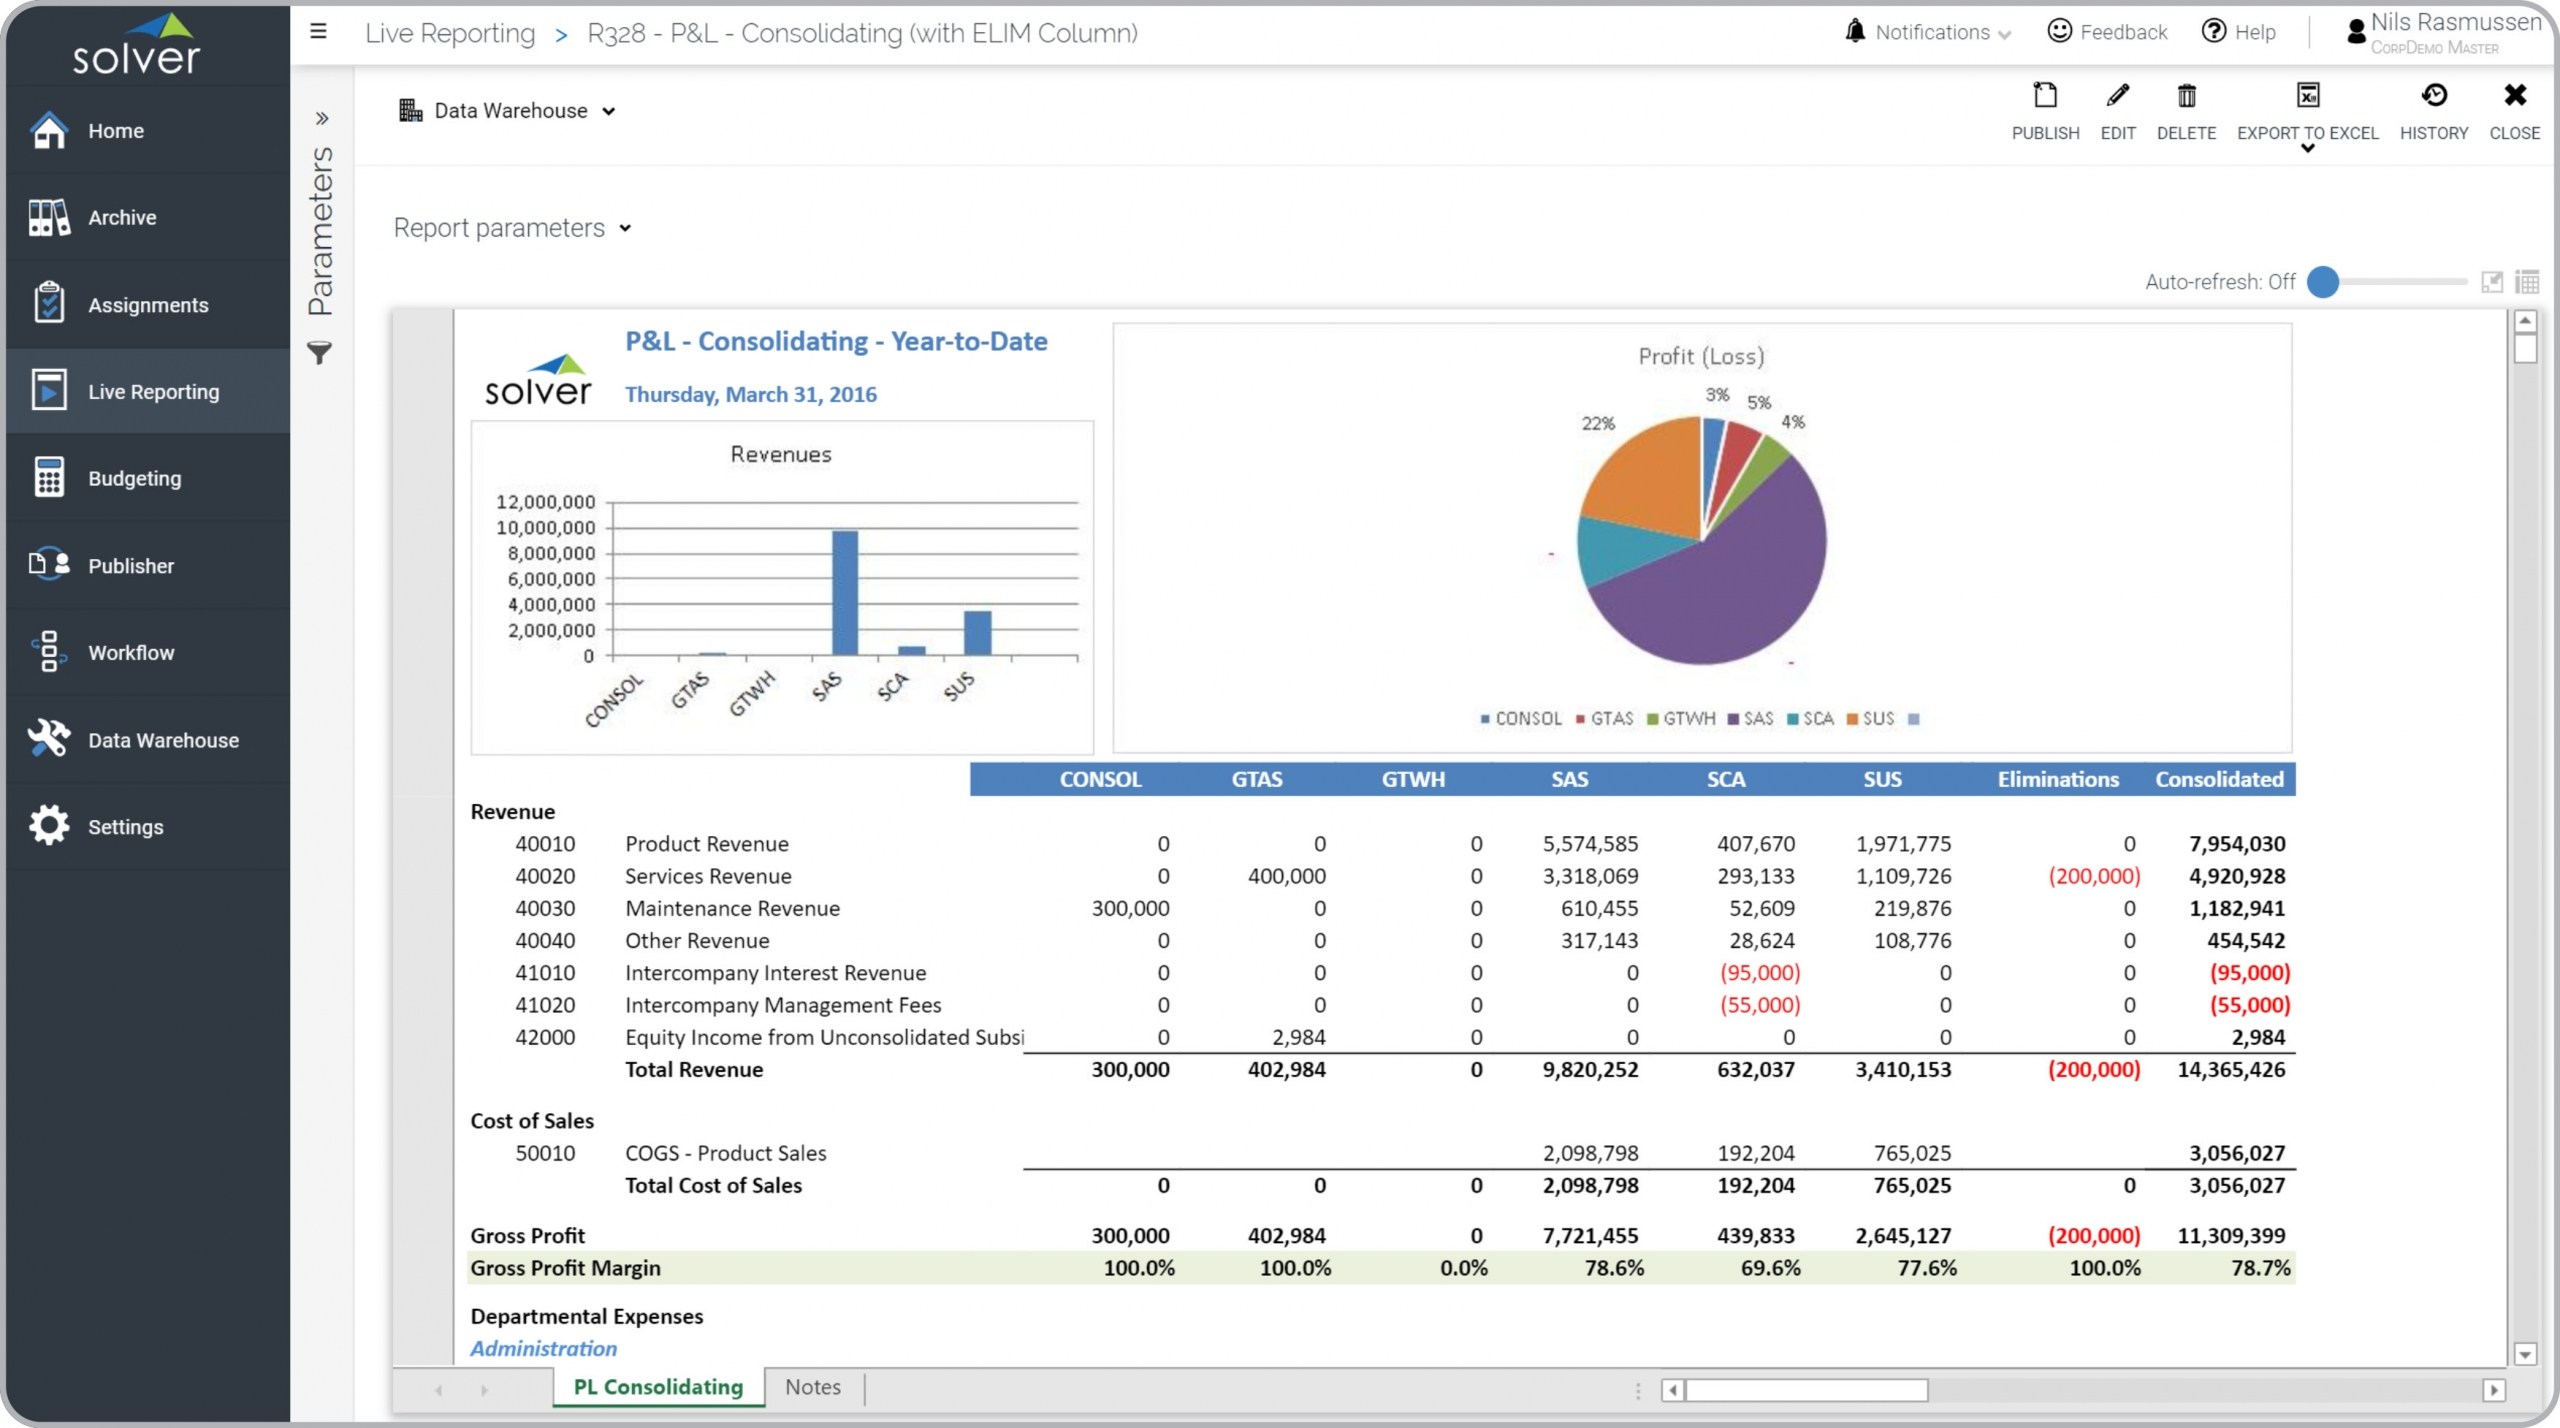
Consolidating Profit & Loss Report
What is a Consolidating Profit & Loss Report ? Consolidating Profit & Loss (P&L) ...
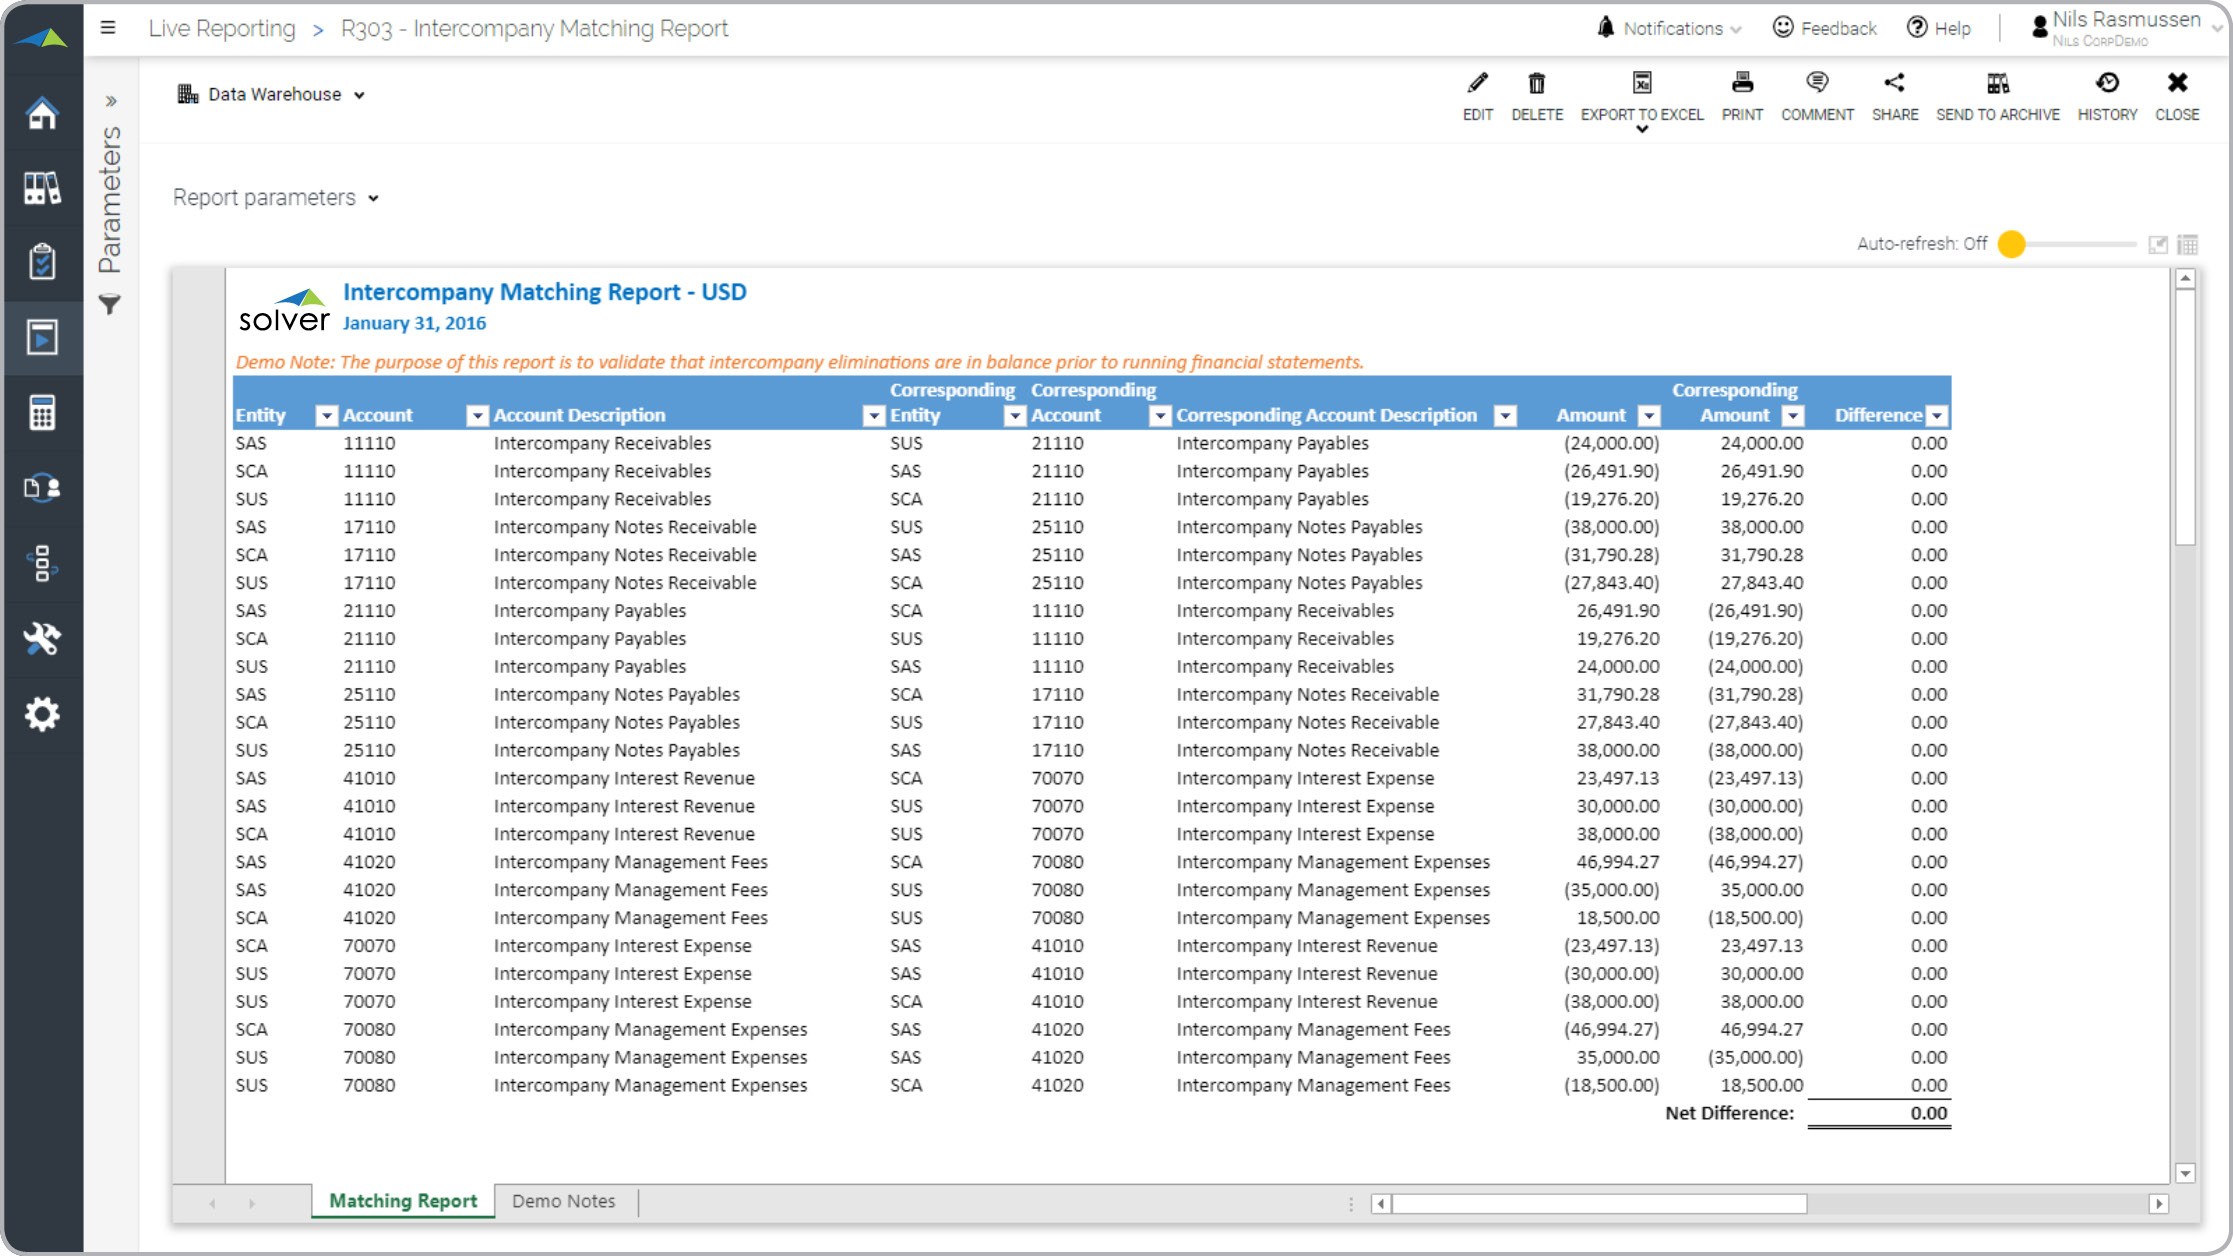
Intercompany Matching Report
What is a Intercompany Matching Report ? Intercompany Matching reports are considered important ...
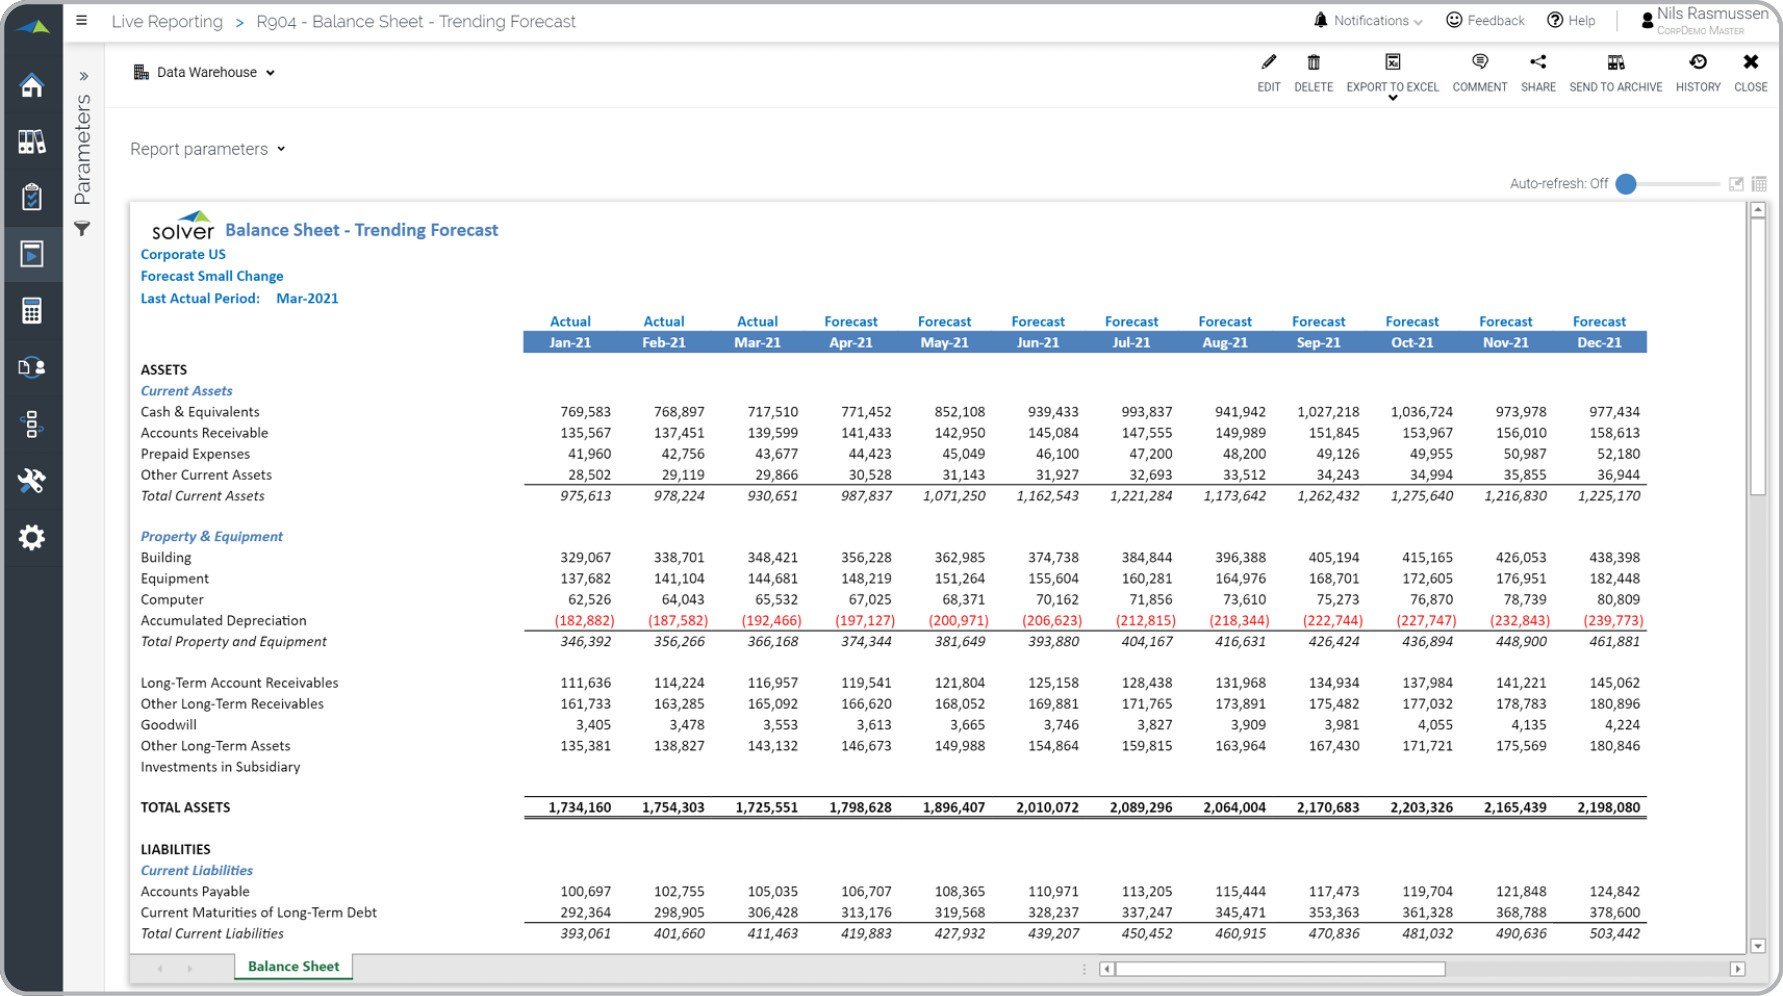
Monthly Balance Sheet Forecast Report
What is a Monthly Balance Sheet Forecast Report ? Balance Sheet Forecasts are considered key ...
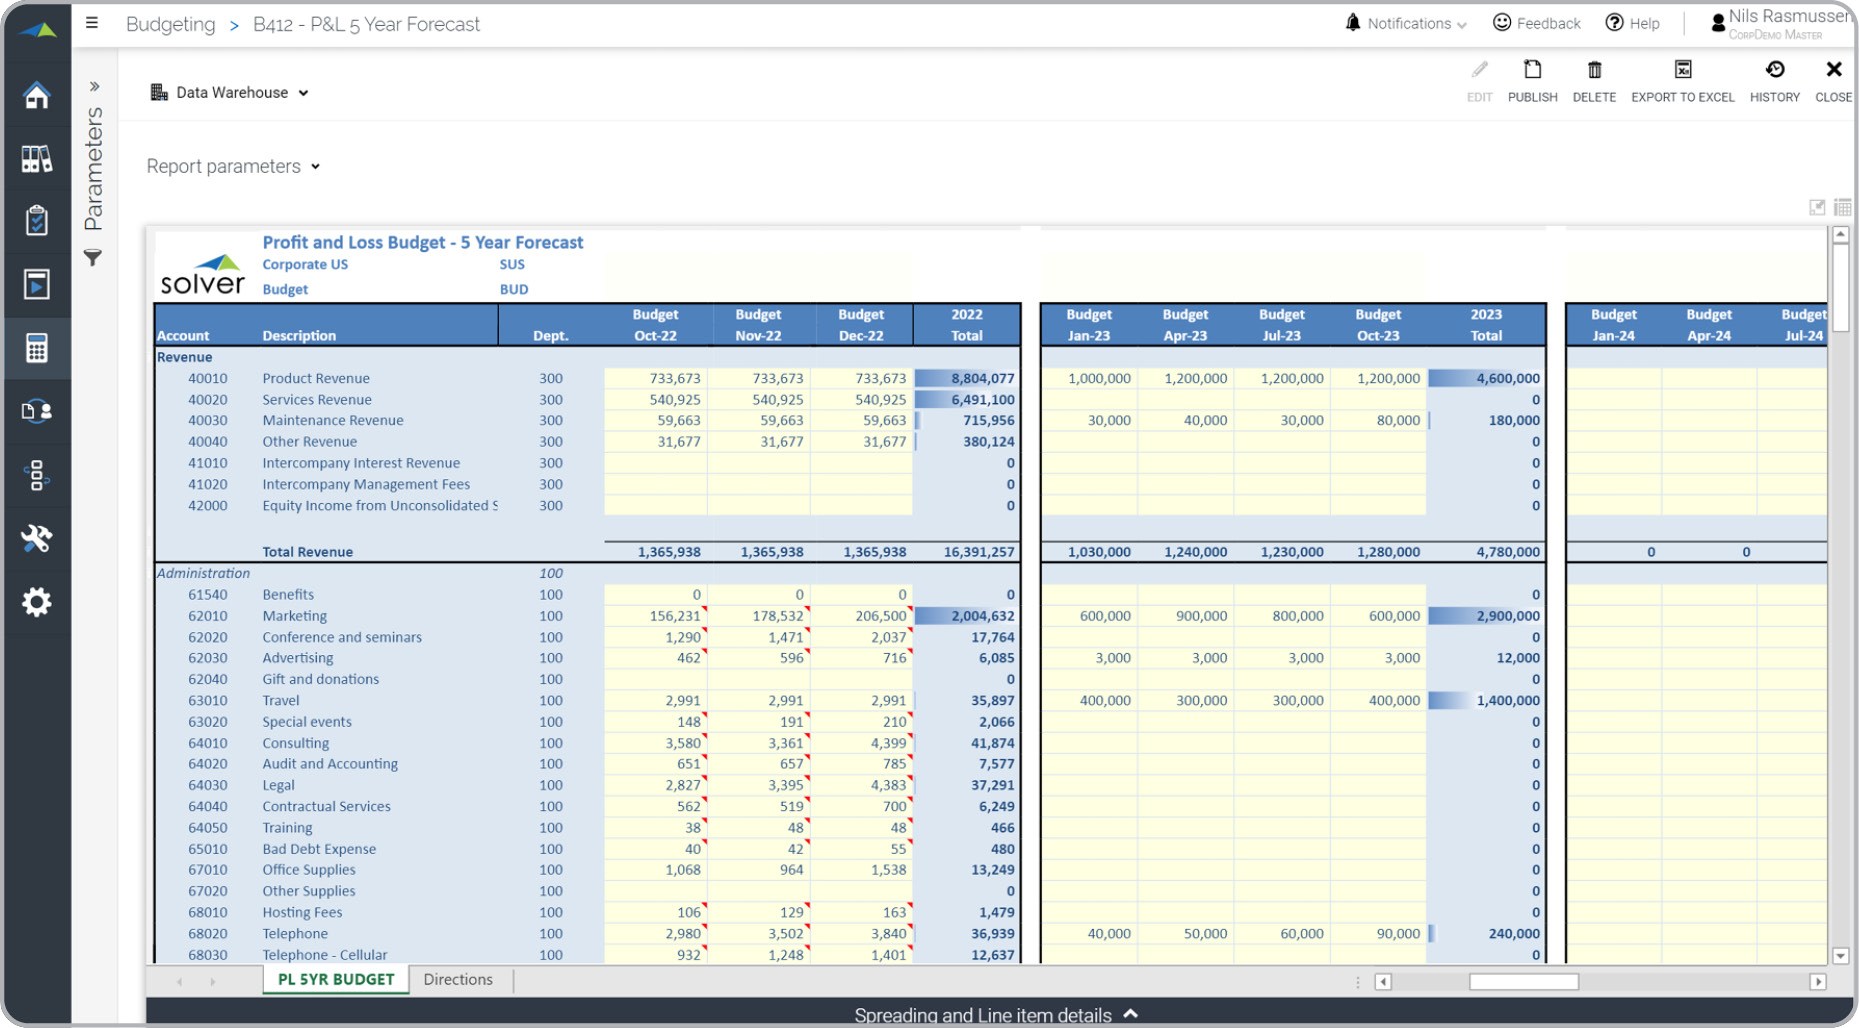
Multi-Year Forecast Input Template
What is a Multi-Year Forecast Input Template ? Multi-Year Forecasts are considered strategic ...
How to Create a Successful Demand Plan
At the core of every business strategy for products and services is to provide optimal management ...
How to Implement Workforce Forecasting for Your Business
Forecasting is always an essential part of any business, and the workforce is typically the largest ...
Best Financial Consolidations Solutions for Your ERP System
While mid-market and enterprise resource planning (ERP) vendors offer native financial ...
How to Do a Budget Variance Analysis in 30 Minutes
Budgets can be difficult. While properly analyzing trends and patterns in your financial history ...
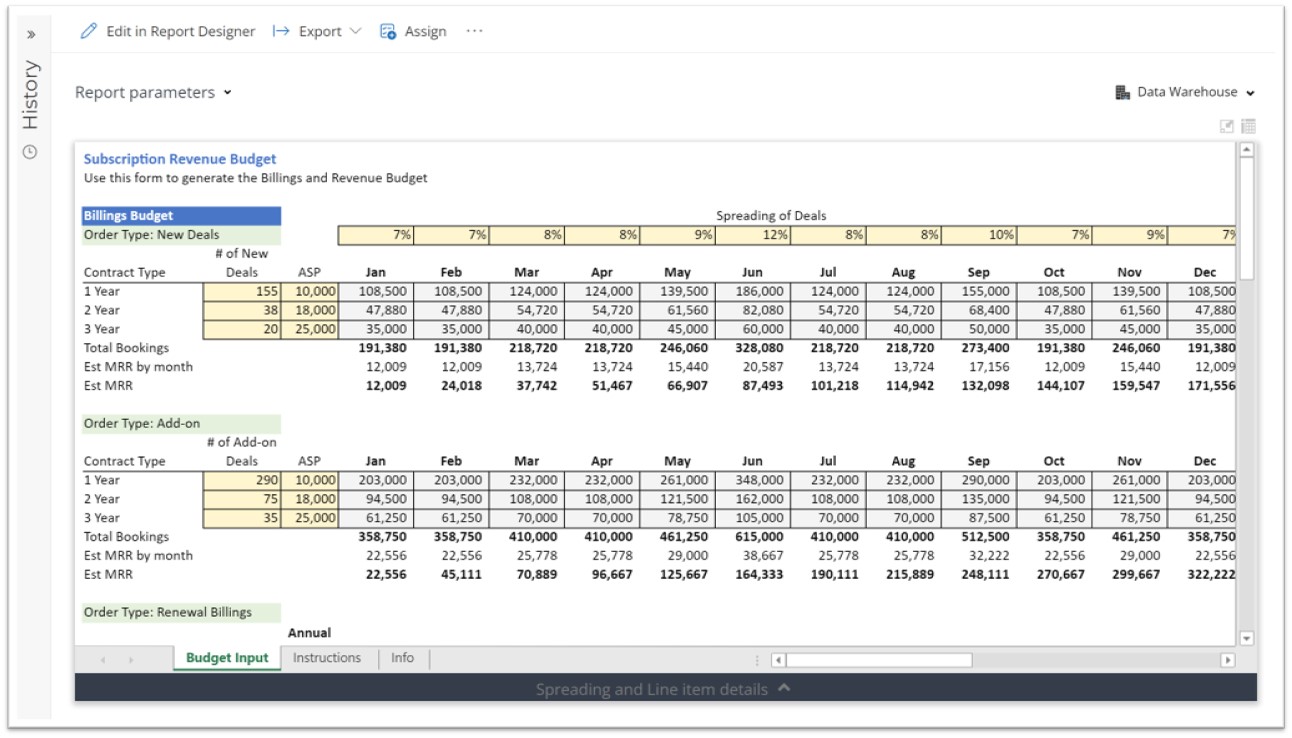
Subscription Revenue Budget Model for SaaS Companies using Dynamics 365 Business Central
This article describes the Subscription Revenue Budget Template that is included with Solver's SaaS ...
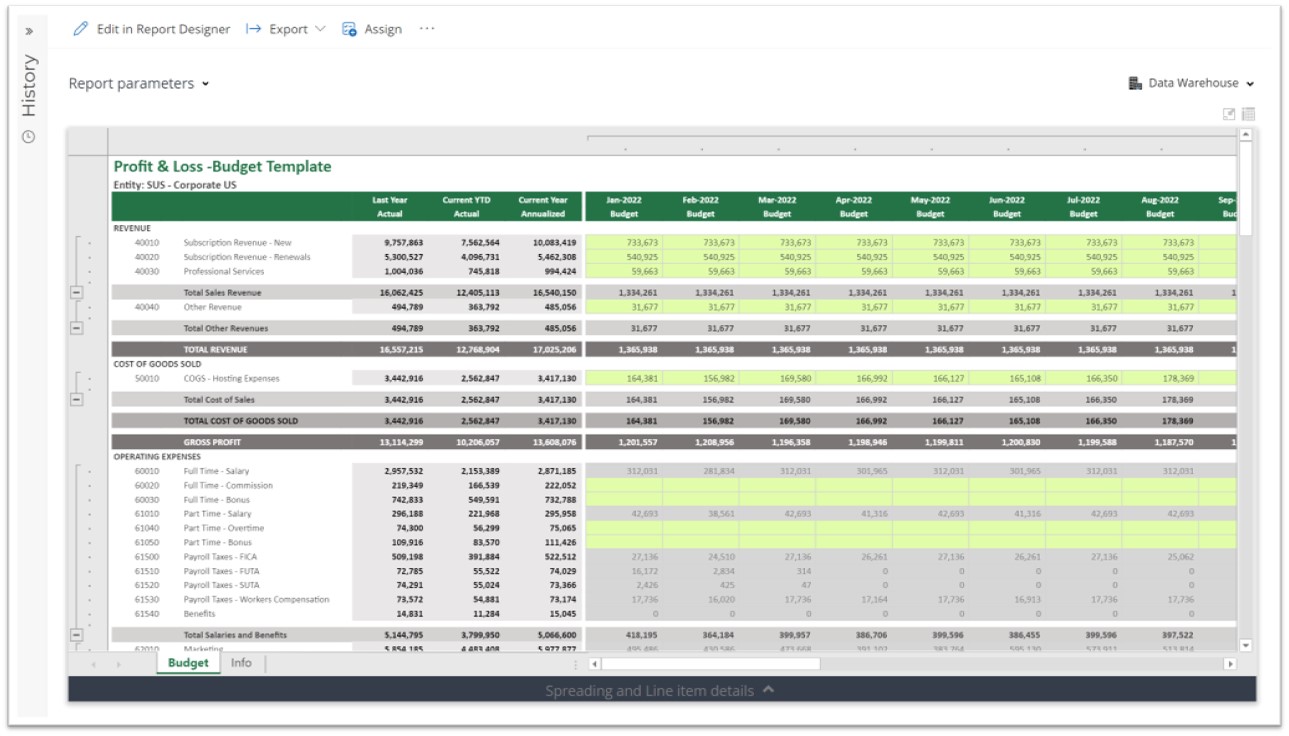
Profit & Loss Budget Model for SaaS Companies using Dynamics 365 Business Central
This article describes the Profit & Loss Budget Template that is included with Solver's SaaS ...
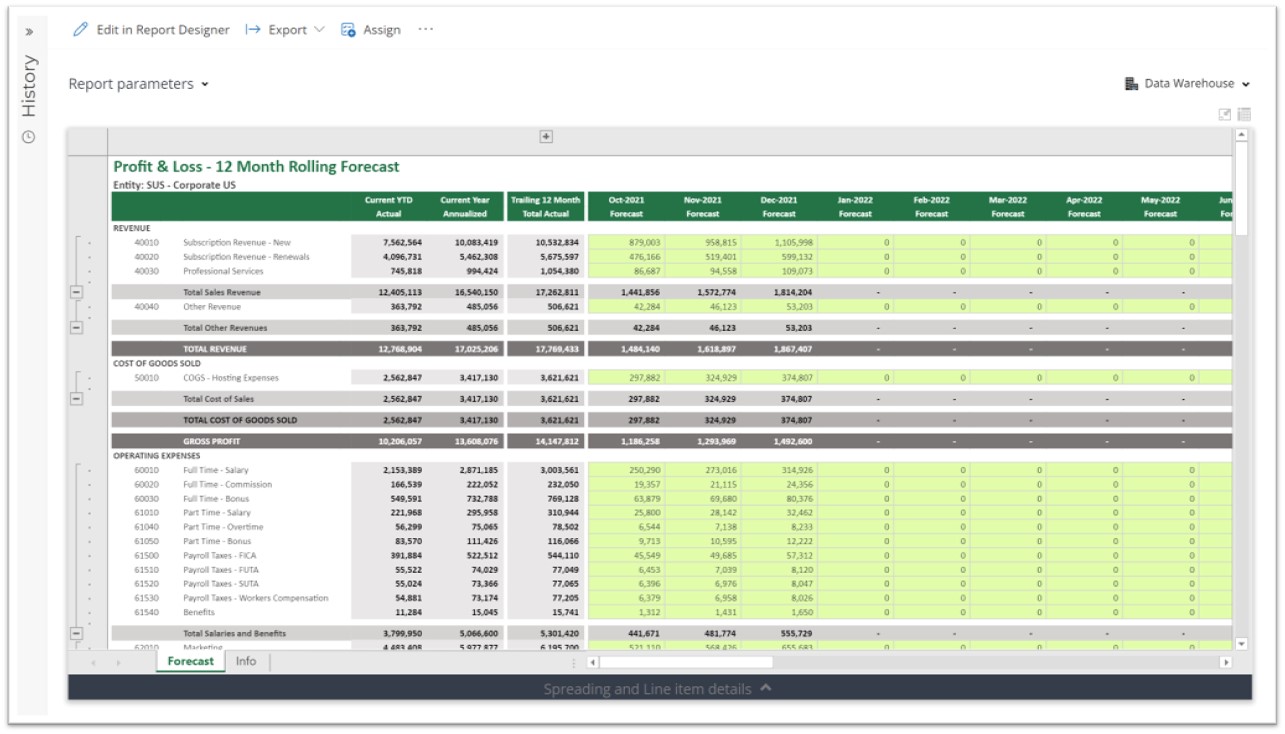
Twelve Month Rolling Forecast Model for SaaS Companies using Dynamics 365 Business Central
This article describes the Twelve Month Rolling Forecast Template that is included with Solver's ...
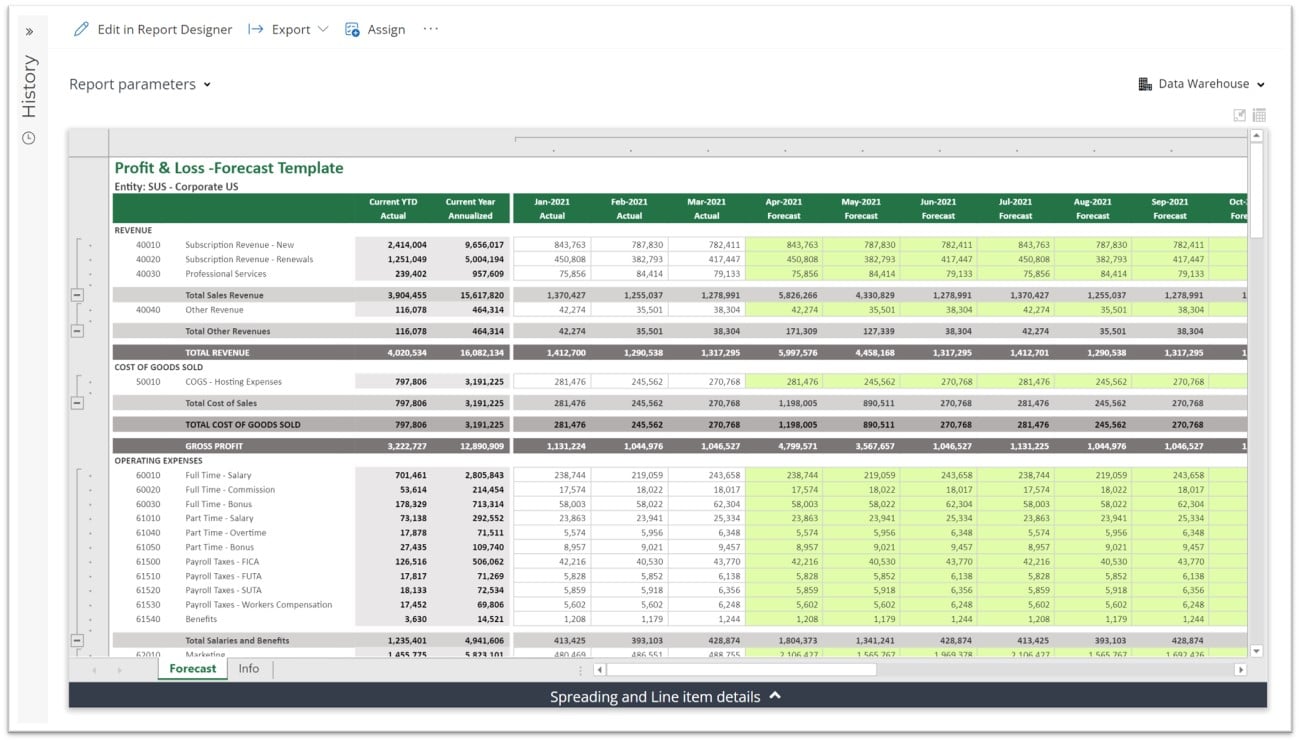
Profit & Loss Forecast for SaaS Companies using Dynamics 365 Business Central
This article describes the Profit & Loss Forecast Template that is included with Solver's SaaS ...
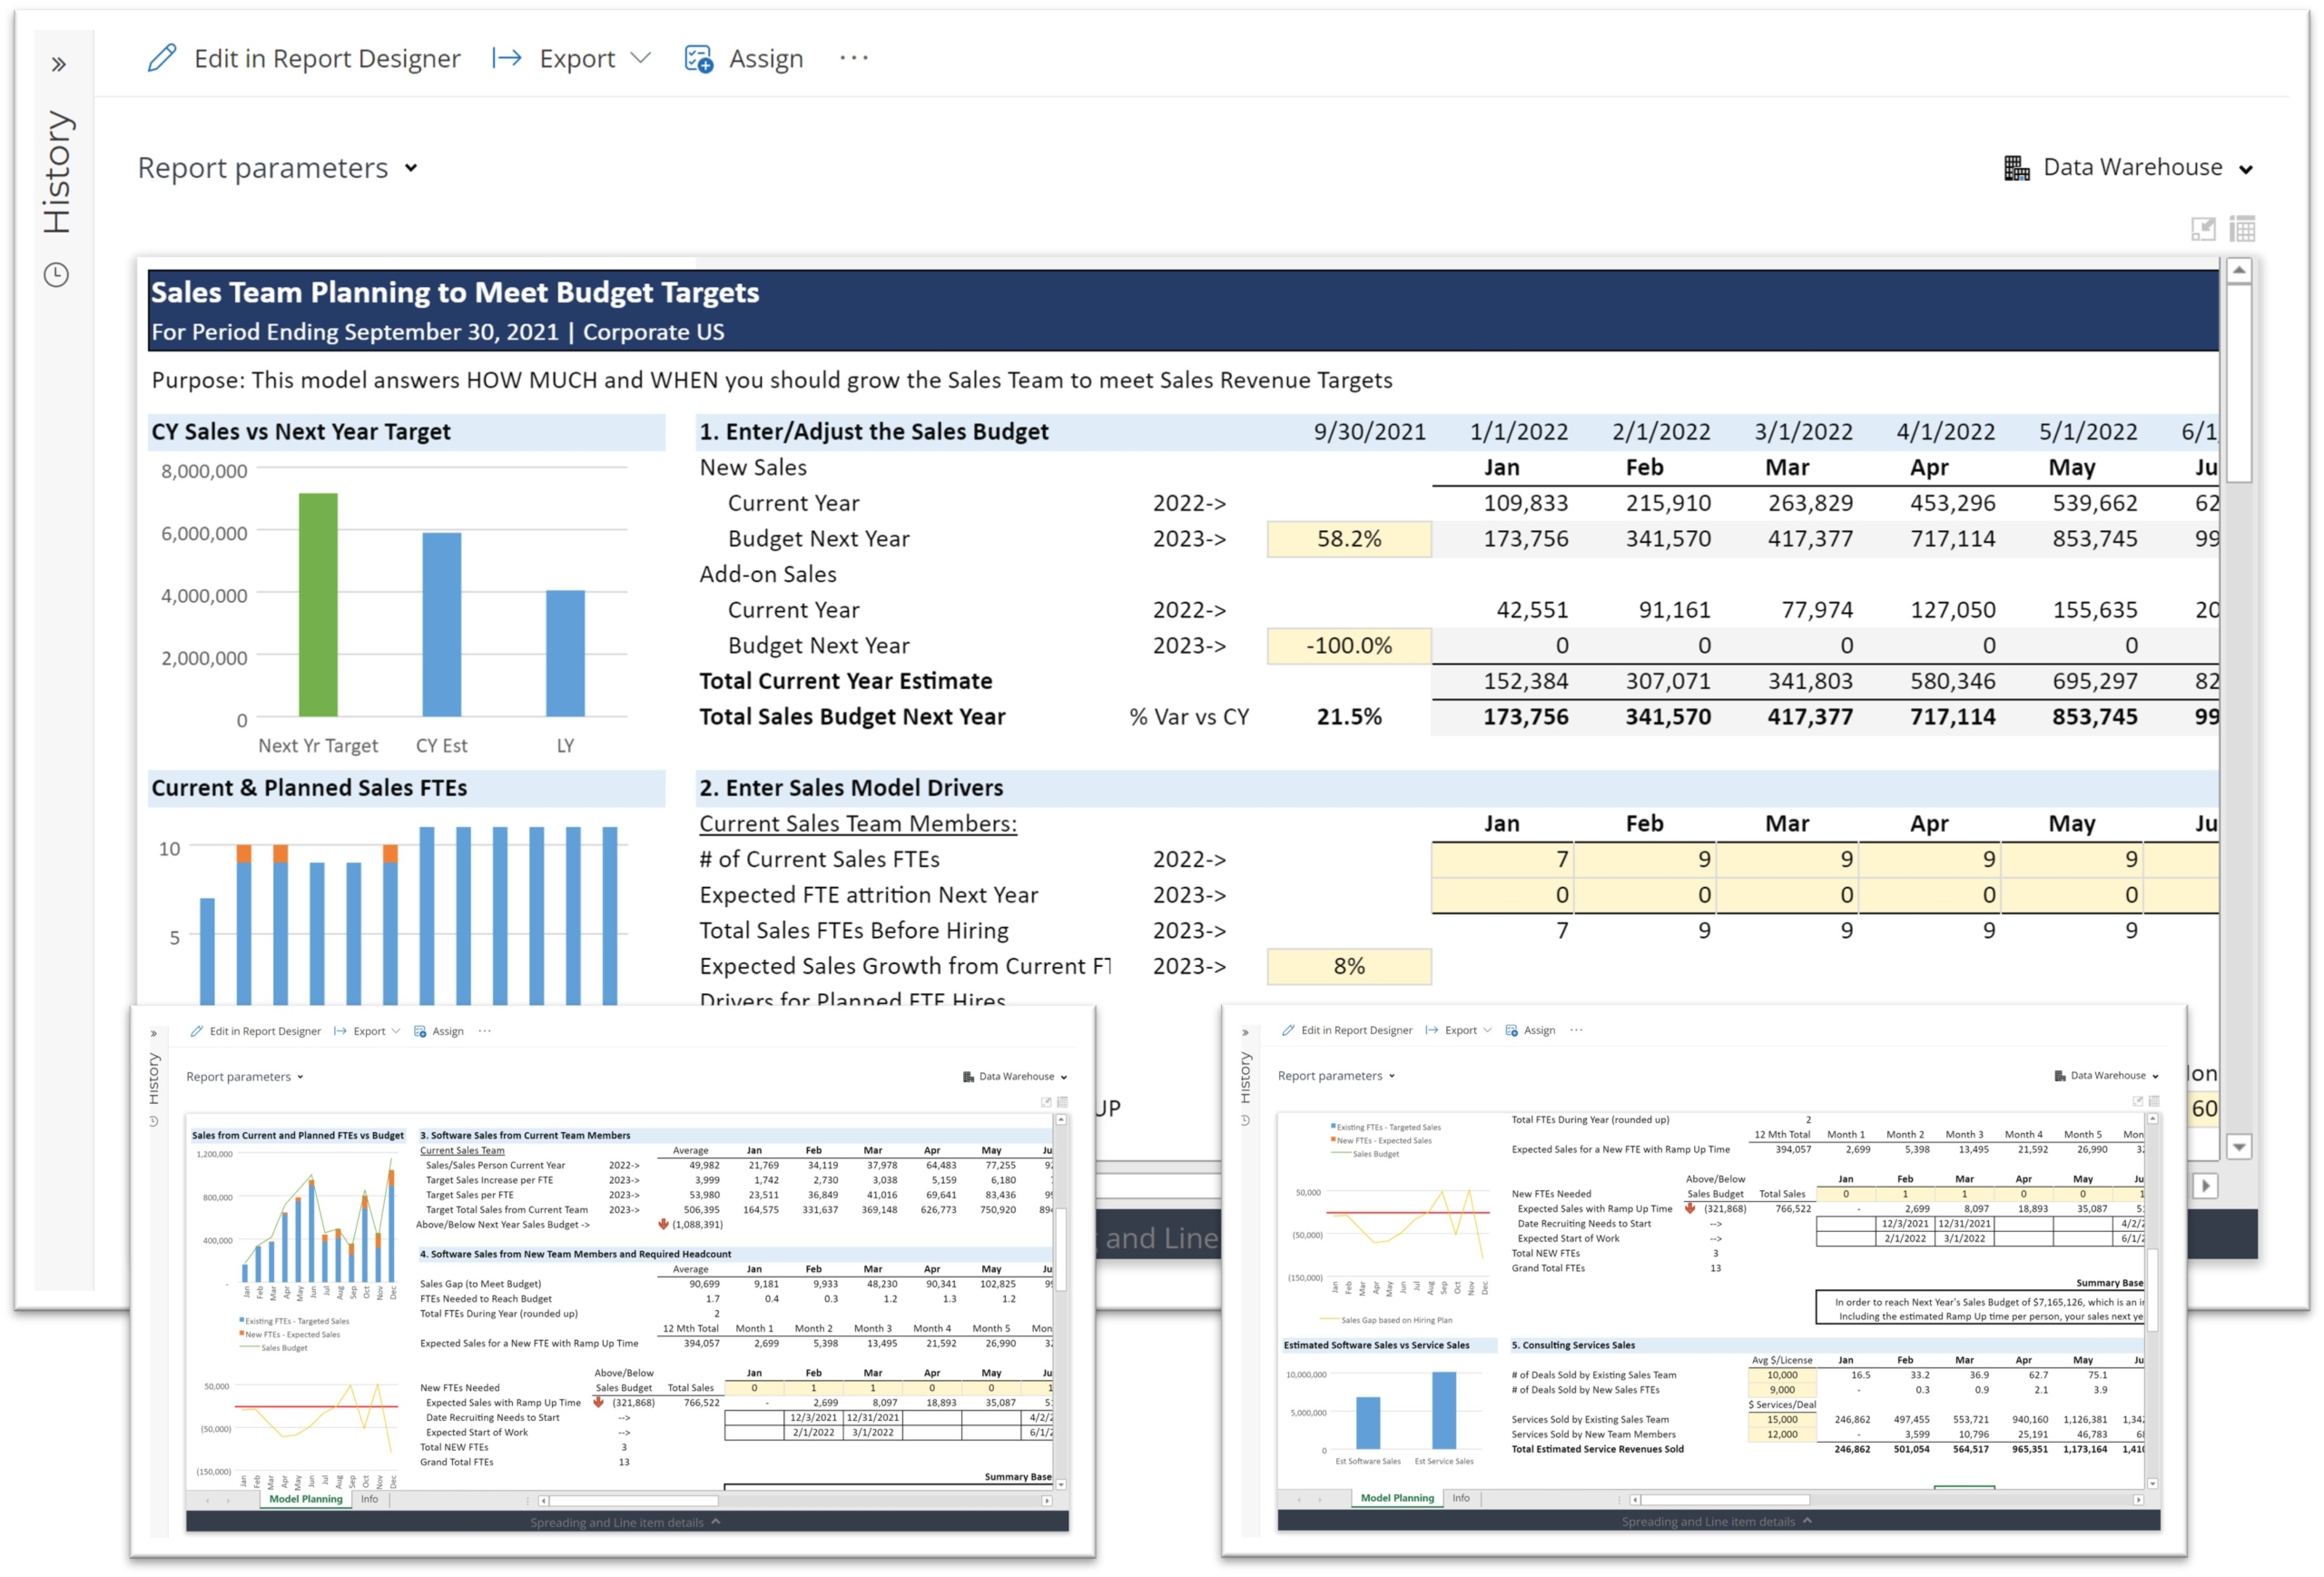
Sales Team Planning Model for SaaS Companies using Dynamics 365 Business Central
This article describes the Sales Team Planning Template that is included with Solver's SaaS model ...
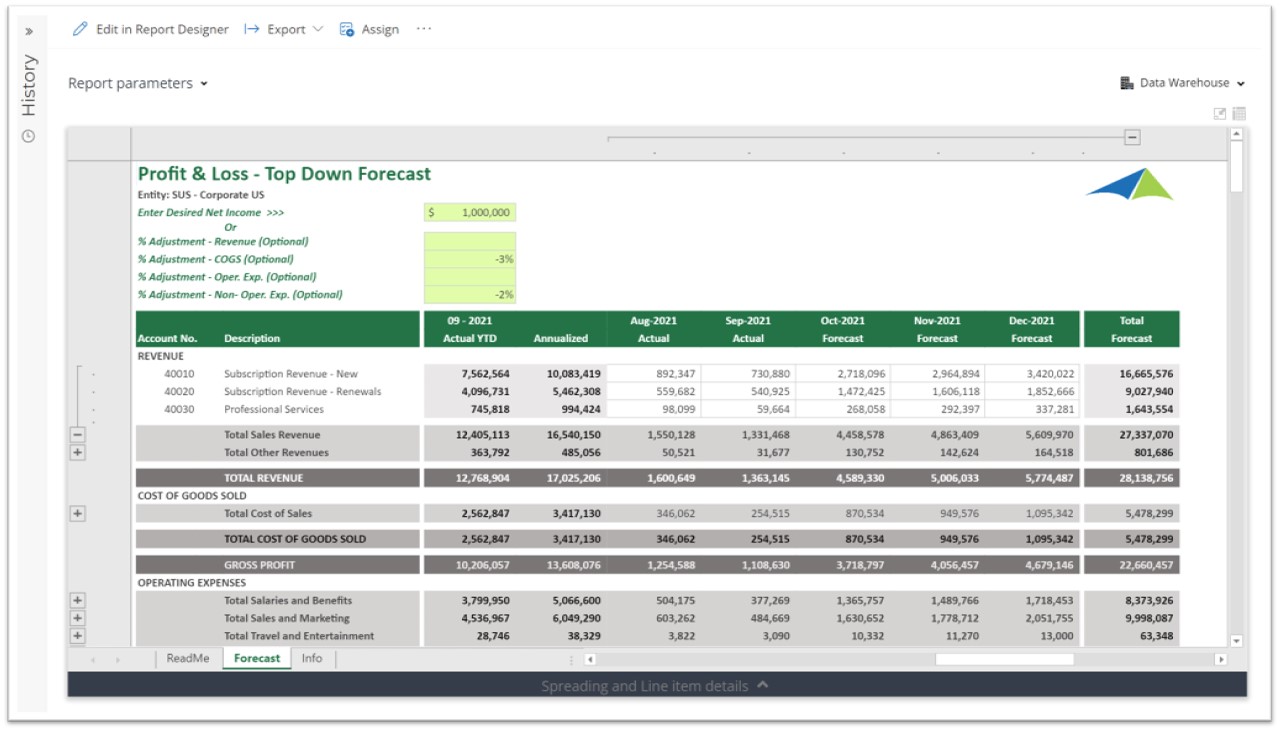
Driver-based Profit & Loss Forecast for SaaS Companies using Dynamics 365 Business Central
This article describes the Top Down Driver-based Profit & Loss Forecast Template that is ...
A New Era for the CFO with Integrated Dashboards and Financial Reports in the Cloud
This article focuses on the best of both worlds: a world-class reporting solution and a leading ...
How to Align Your Business Strategy with Your Reporting, Planning and Analysis
Image taken from Shutterstock.
Cloud Reporting for Microsoft Dynamics 365 Finance
Microsoft Dynamics 365 offers two versions that combine the Dynamics customer relationship ...
How to Prepare for Your First Dashboard Implementation
This article will discuss the process of preparing for a successful dashboard implementation plan. ...
No Data Found!
1
Page 1 of 1