

Solver-markedsplads
Udforsk efter funktionalitet (rapporter, planlægning og dashboard-skabeloner), eller brug søgefunktionen til at filtrere efter integration, branche eller for at finde en skabelon, der passer til dine specifikke behov. Gem skabeloner på din favoritliste, og brug linket »Del favoritter« til at dele listen med andre.
Ikonforklaring:
💲 Kræver konsulenttimer til opsætning og konfiguration
⭐ Gem som favorit og del med andre
FUNCTIONALITY
- Reports
- Planning
- Dashboard
Data Source
Marketplace Data Source: Filter by Data Source to find assets specific to your system
Showcase Data Source: Filter by Data Source to find assets specific to your system
Industries
Marketplace Industries: Filter by Industries to find assets specific to your system
Showcase Industries: Filter by Industries to find assets specific to your system
industries
Marketplace Industries: Filter by your industry to find assets created for your specific needs
Showcase Industries: Filter by your industry to find assets created for your specific needs
577 - 582 of 868 Results
Favorite Page Results
Favorites


Reports
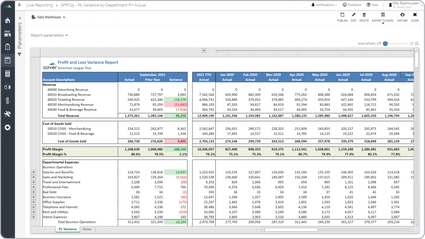
Sports – P&L with Variance Analysis
Profit & Loss (P&L) It can be run for any given period and will dynamically list year-to-date and monthly figures with actual and prior year with variances.
$
Reports
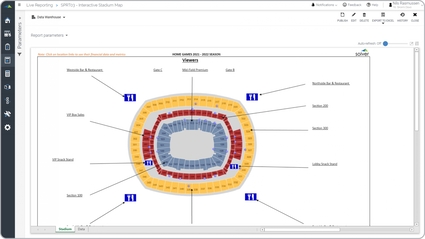
Sports – Stadium Metrics
It displays an easy to understand map of the stadium with hyperlinks to each revenue-generating location.
$
Planning
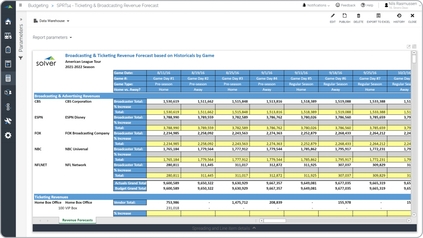
Sports – Ticket and Media Forecast
Broadcasting and ticketing budgets and forecasts are considered revenue planning tools and are used by budgeting managers to create detailed bottom-up revenue estimates.
$
Dashboard
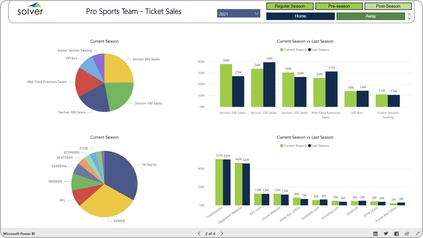
Sports – Ticket Sales Analysis
It provides analysis from four different perspectives:. Pie chart - Total ticket sales by seat type for the current and prior year seasons,.
$
Reports
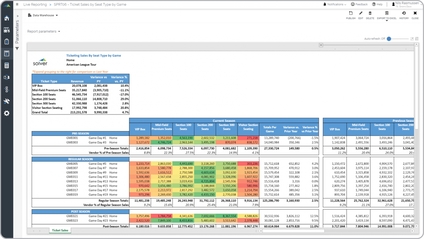
Sports – Ticket Sales by Seat Type
It shows stadium seat revenue parched up into key categories. The report starts with a summary of total revenue by seat category with variances versus prior year.
$
Reports