

Solver-markedsplads
Udforsk efter funktionalitet (rapporter, planlægning og dashboard-skabeloner), eller brug søgefunktionen til at filtrere efter integration, branche eller for at finde en skabelon, der passer til dine specifikke behov. Gem skabeloner på din favoritliste, og brug linket »Del favoritter« til at dele listen med andre.
Ikonforklaring:
💲 Kræver konsulenttimer til opsætning og konfiguration
⭐ Gem som favorit og del med andre
FUNCTIONALITY
- Reports
- Planning
- Dashboard
Data Source
Marketplace Data Source: Filter by Data Source to find assets specific to your system
Showcase Data Source: Filter by Data Source to find assets specific to your system
Industries
Marketplace Industries: Filter by Industries to find assets specific to your system
Showcase Industries: Filter by Industries to find assets specific to your system
industries
Marketplace Industries: Filter by your industry to find assets created for your specific needs
Showcase Industries: Filter by your industry to find assets created for your specific needs
475 - 480 of 868 Results
Favorite Page Results
Favorites


Reports
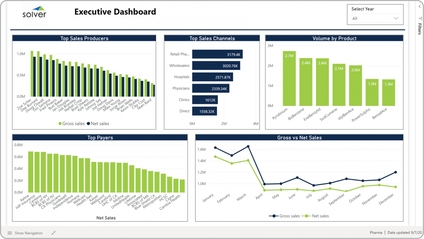
Pharma – Executive Dashboard
It provides analysis from five different perspectives, including:. Top sales producers with ranked gross sales and net sales,. Top sales channels,.
$
Dashboard
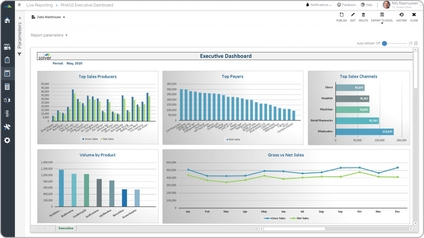
Pharma – Executive Power BI Dashboard
It provides a single screen to analyze business KPIs from five different perspectives:. Top sales producers ranked by gross and net sales,. Revenues from the top sales channels,.
$
Reports
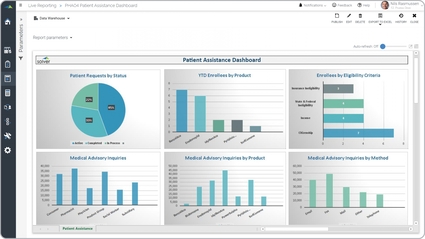
Pharma – Patient Assistance Dashboard
Tracks patient assistance program metrics including applications, approvals, costs, and drug utilization by therapy area. Helps pharmaceutical finance and compliance teams monitor program spend.
$
Dashboard
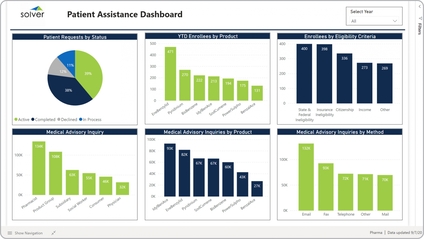
Pharma – Patient Dashboard
It offers key insights that measures program performance from six different perspectives:. Patient request by status (active, completed, declined, in process),.
$
Reports
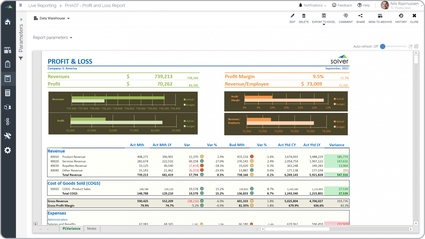
Pharma – Profit & Loss Report
Profit & Loss (P&L) It is parameter driven and combines a classic P&L layout with charts that highlight the KPIs in the report.
$
Reports
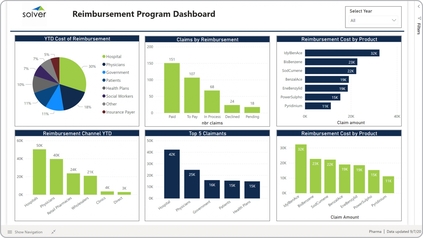
Pharma – Reimbursement Dashboard
It provides graphical analysis of five key performance indicators (KPIs), including:. Year-to-date (YTD) costs of reimbursement requests,.
$